Khipu Visualisation
Khipu is an interactive visualisation tool for exploring network measurement data from RIPE Atlas. It provides a hierarchical tree view of network paths, supporting traceroute, DNS, and ping measurements with multiple visualisation modes.
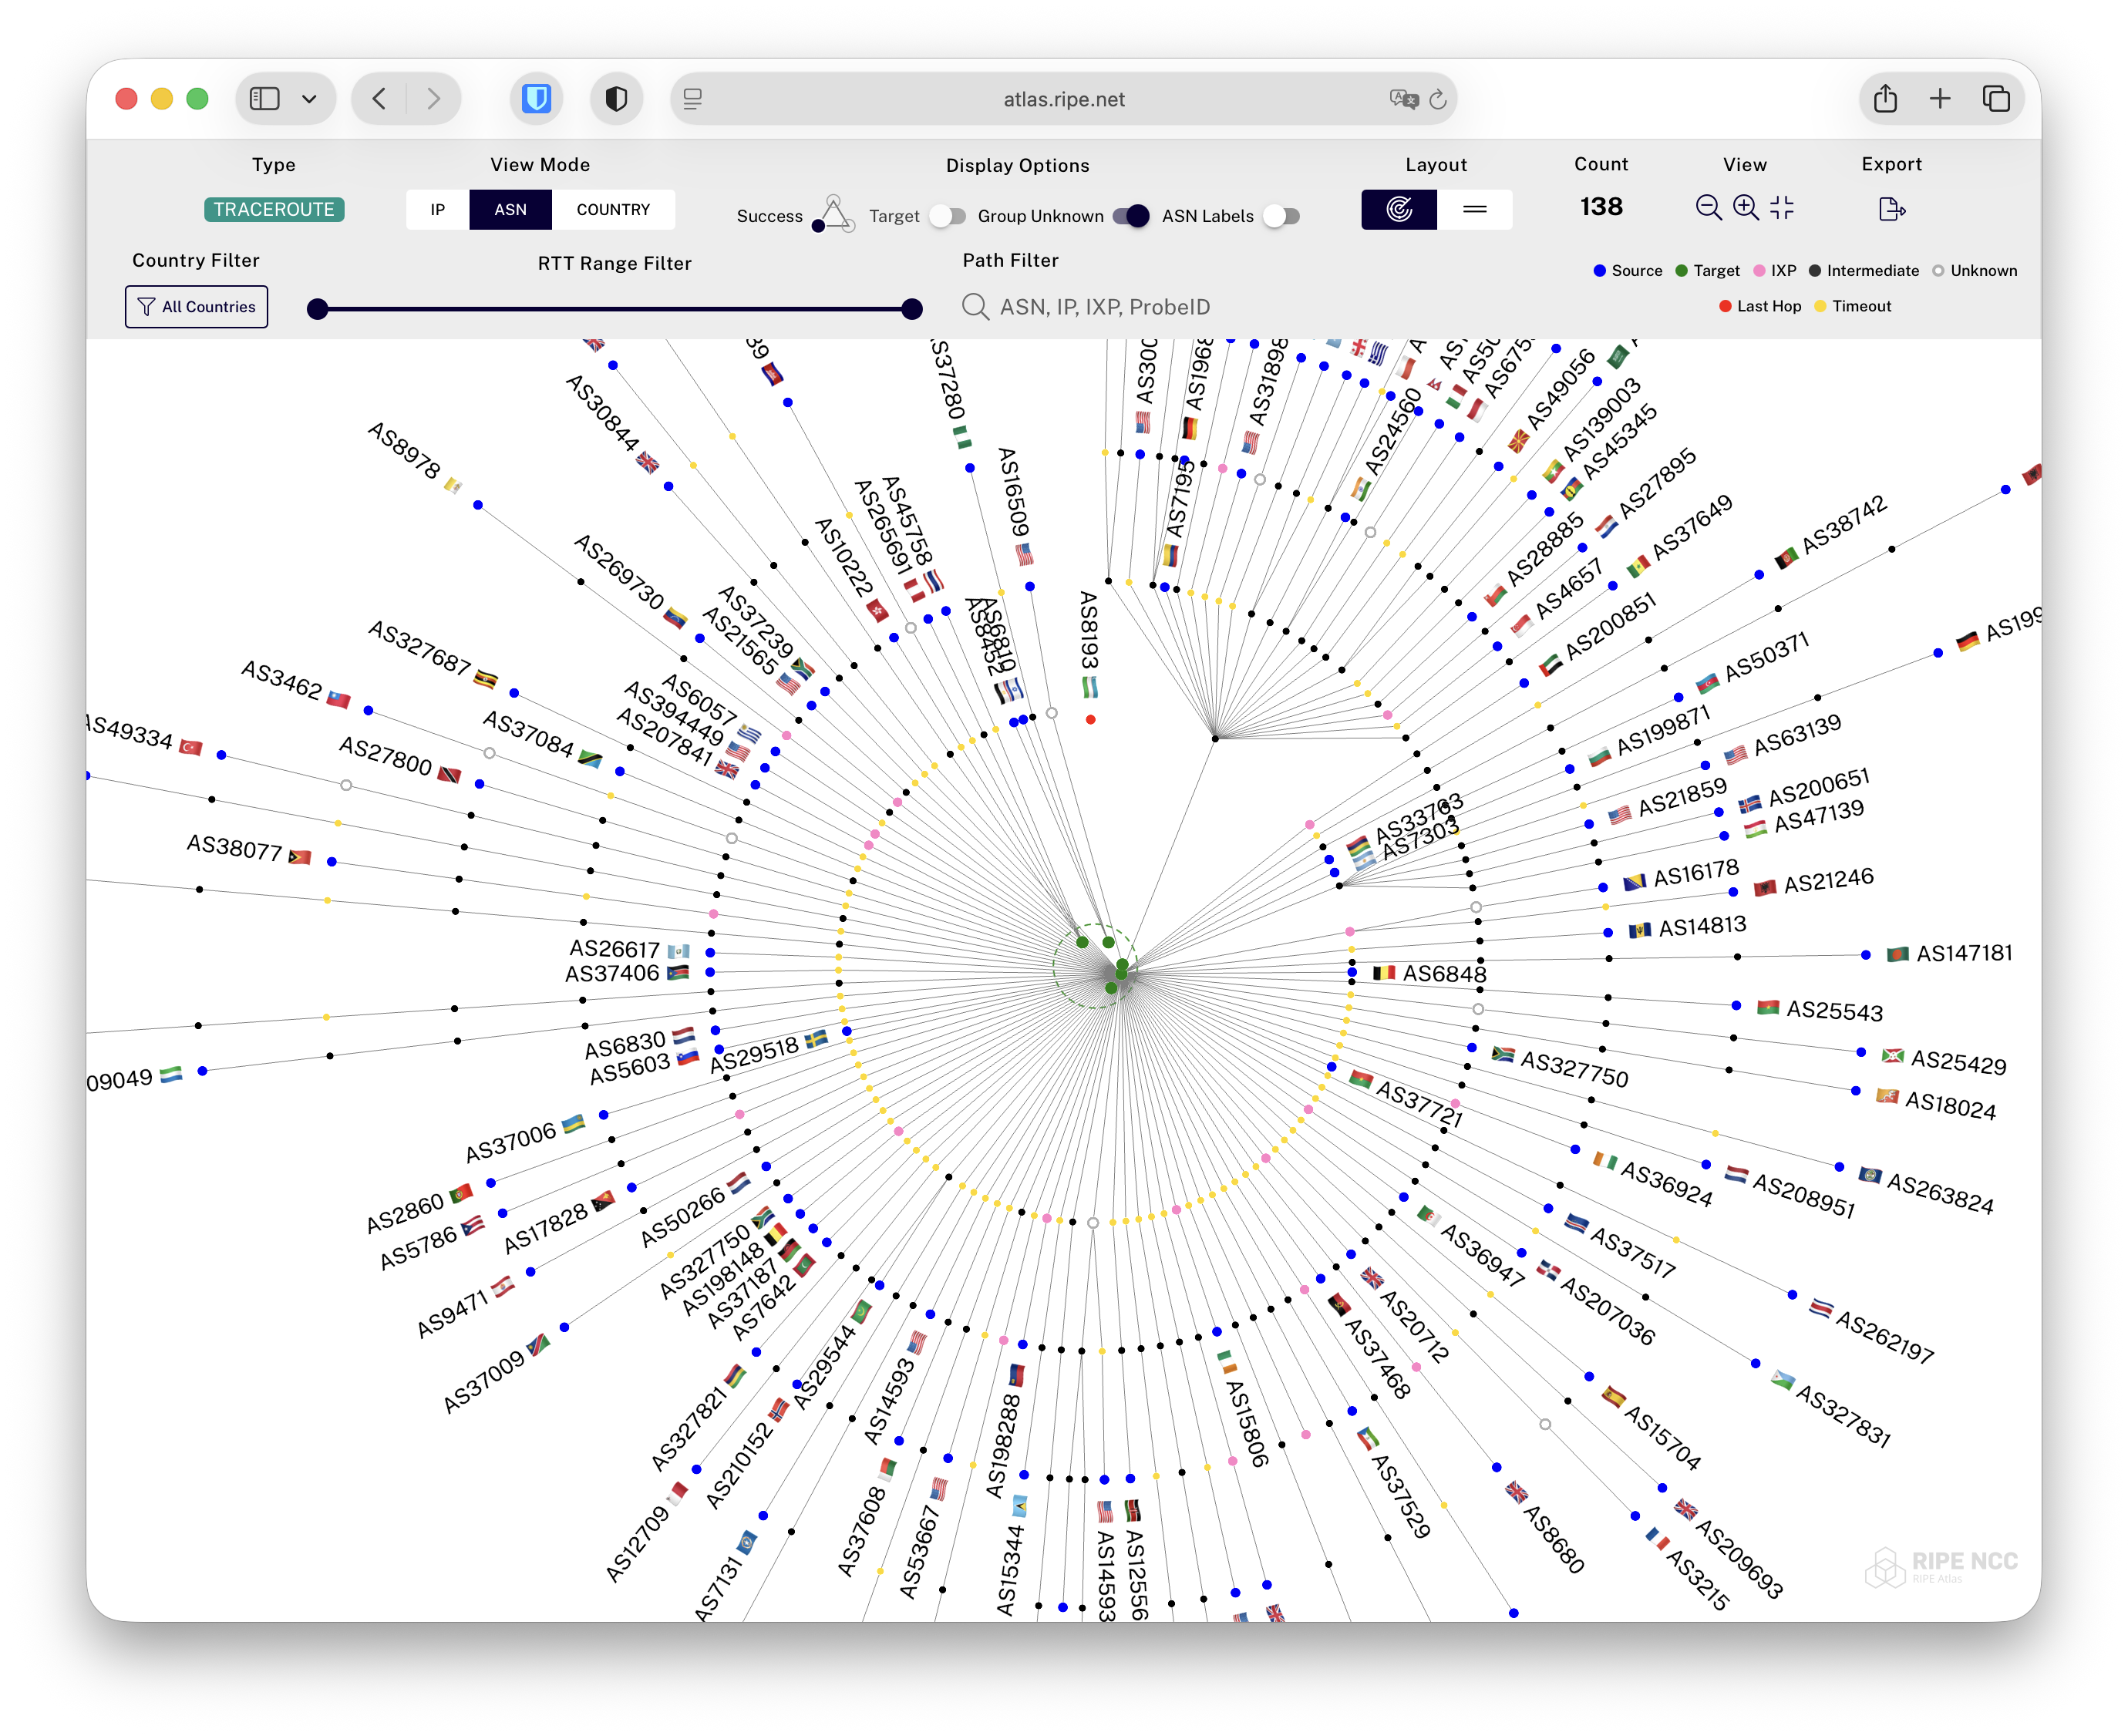 Khipu fullscreen ASN view example
Overview
Khipu transforms complex network measurement data into intuitive visual representations, allowing you to:
- Visualize network paths as interactive tree structures
- Explore data at different abstraction levels (IP, ASN, Country)
- Filter and analyze measurements based on various criteria
- Identify patterns, anomalies, and network characteristics
Supported Measurement Types
Traceroute
Displays the path packets take from source probes to destination targets, showing each hop along the route.
DNS
Visualizes DNS query paths and responses, showing the route to DNS resolvers and query results.
Ping
Shows ping measurement results in a simplified view, focusing on connectivity and response times.
View Modes
Khipu offers three distinct view modes for traceroute measurements, each providing different insights into your network data:
IP View
The most detailed view, showing individual IP addresses for each hop in the network path.
- Displays exact IP addresses at each hop
- Shows probe IDs or IP addresses for source nodes
- Reveals the complete routing path
- Best for detailed path analysis and troubleshooting
ASN View
Groups IP addresses by their Autonomous System Numbers, providing an organisational view of the network path.
- Consolidates IPs into their respective ASNs
- Shows AS names and numbers
- Identifies transit providers and network boundaries
- Useful for understanding routing policies and peering relationships
Country View
The highest level abstraction, grouping nodes by geographic location.
- Groups hops by country
- Uses country names or two-letter codes
- Visualizes geographic routing patterns
- Helpful for understanding regional connectivity and latency patterns
WARNING
NOTE: Khipu uses a combination of IPLocate, PeeringDB, and RIPE Registry sources to determine location, but no ip location system is perfect and there will often be errors, especially with CDNs and similar addresses.
User Interface
Toolbar Controls
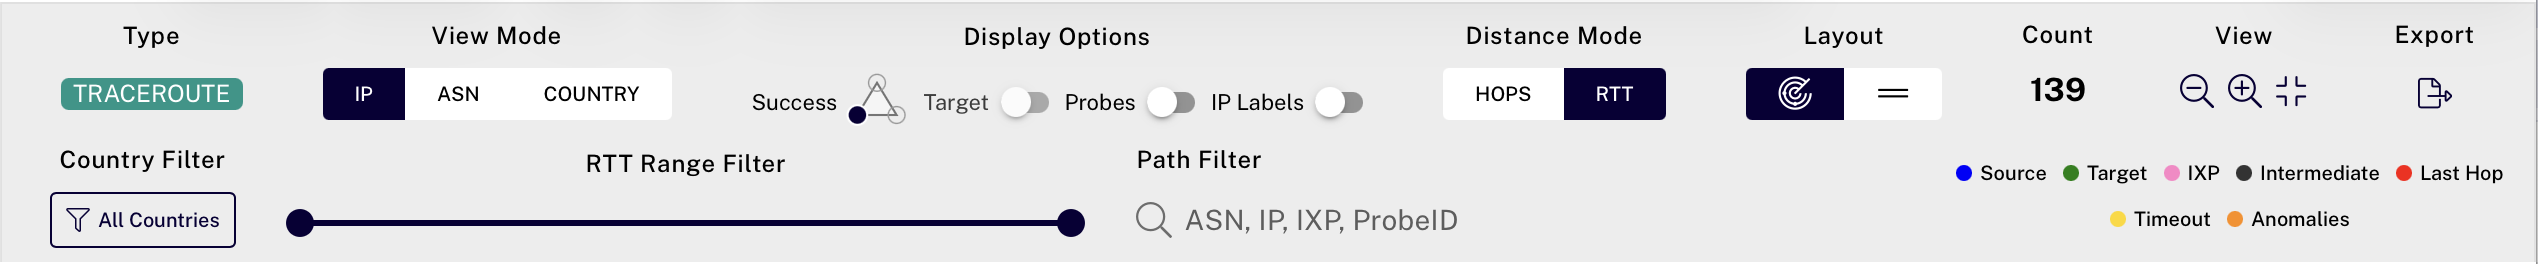 Khipu toolbar in IP view
The Khipu toolbar provides comprehensive control over the visualisation:
Measurement Type Badge
Displays the current measurement type (TRACEROUTE, DNS, or PING) with colour coding:
- Teal for traceroute
- Light Blue for DNS
- Light Green for ping
View Mode Toggle (Traceroute only)
Switch between IP, ASN, and Country views using the button toggle.
Display Options
- Success: tri-part button for showing All (default), Successul only, or Failed only
- Target: Display target node information (disabled for multi-target measurements)
- Probes (IP view): Toggle between showing probe IDs or IP addresses
- IP Labels (IP view): Toggle on to show IP labels on all nodes
- Group Unknown (ASN view): Group unknown intermediate ASN nodes together
- ASN Labels (ASN view): Show or hide ASN labels on all nodes
- Short Names (Country view): Use two-letter country codes instead of full names
Distance Mode (IP view only)
Choose how vertical distance is calculated:
- HOPS: Equal spacing based on hop count
- RTT: Spacing based on round-trip time for more accurate latency representation
Layout
Choose between radial or horizontal presentation of data.
Count
- Count: Displays the number of visible paths (changes as filters are applied)
View Controls
- Zoom In/Out: Adjust the visualisation scale
- Fullscreen: Enter or exit fullscreen mode for immersive viewing
Export
Export menu allows exporting pngs (1,2,4x) as well as exporting filtered or full data set in json or csv
Filtering Options
RTT Range Filter
Use the dual-handle slider to filter measurements by round-trip time:
- Drag handles to set minimum and maximum RTT values
- Shows "ALL" when maximum is reached
- Automatically disabled when showing only failed traces
INFO
NOTE: The RTT filter only applies to successful paths; failed traces are not affected by RTT range settings.
Path Filter
Search for specific elements in network paths:
- For traceroute: Filter by IP, ASN, IXP, or Probe ID
- For DNS: Filter by IP, ASN, RCODE, NSID, or answer data
- Supports partial matching
- Supports multiple terms
- Include/exclude filter button (to visualise paths that match or don't match term)
- Updates visualisation in real-time after debounce
- IXP names are searchable (e.g., "AMS-IX", "DE-CIX"), or one can type simply "ixp" to filter out all non-ixp routes.
Country Filter
Use the country filter menu to include or exclude specific countries:
- Click "All Countries" button to reveal country selection menu
- Filter by country name or by continent that selects all countries in that continent
- Search for any country
- Select All/None
- Invert selection
Interactive Features
Node Interaction
- Hover: View detailed information about any node in a popup
- Shows IP address, ASN, country, and RTT values
- Automatically detects and displays IXP membership with exchange name
- Anycast detection shown for identified anycast addresses
- Click: Select nodes for persistent information display
- Drag: Pan the visualisation to explore different areas
- Scroll: Zoom in and out of the visualisation
Smart Popup Positioning
Popups for source nodes automatically position themselves to avoid obscuring important paths:
- Adjusts position based on node location and available space
- Maintains visibility of connected paths
Colour Legend
 Khipu Traceroute Legend
 Khipu DNS Legend
Access the colour legend through the info button (or if space allows it is auto expanded):
- Source nodes shown in blue
- Target nodes shown in green (Traceroute) or light blue (DNS and Ping)
- IXP nodes shown in pink (Traceroute only)
- Failed traces' last successful hops are shown in red (Traceroute only)
- Intermediate nodes in gray/black (Traceroute only)
- Uknown grouped ASN nodes shown in white with grey stroke (Traceroute, ASN view only)
- Anomalies are shown in orange (Traceroute RTT display mode only)
- RTT in ms with various color values (DNS and Ping only)
- Orange highlighting for selected/hovered paths and nodes
- Light grey lines show paths from the source nodes to the target (or last reached node in case of failure)
Navigation and Controls
Mouse Controls
- Hover: Display node information
- Click (node): Pin popup
- Click (whitespace): dismiss pinned popups
- Click + Drag (whitespace): Pan the view
- Click + Drag (pinned popup): Drag the pinned popup window
- Scroll Wheel: Zoom in/out
Performance Features
Intelligent Caching
Khipu employs smart caching strategies to improve performance:
- Caches ASN lookups and country mappings RIPE NCC RIS
- Caches IXP information from PeeringDB
- Caches IP location information from IPLocate
- Stores processed measurement data
- Reduces API calls for repeated queries
Hardware leverage
- WebGL-based to use graphics hardware for best performance with large datasets
Progressive Loading
For large datasets:
- Initial render shows available data immediately
- Visual loading indicators during data processing
Single vs Multi-Target Visualisation
When Multiple Targets Appear
Khipu automatically detects and displays multiple targets when (all of the below):
- The measurement target is a domain name (not an IP address)
- DNS resolution was performed on each probe (not pre-resolved)
- The domain resolves to different IP addresses for different probes
This commonly occurs with:
- CDN endpoints (different IPs for geographic distribution)
- Load-balanced services (multiple backend servers)
Working with Multiple Targets
When multiple targets are detected:
- The "Target" display option is automatically disabled in the toolbar
- Each target node appears separately in the visualisation
- Hover over any target node to see its specific IP address
- Anycast addresses are automatically detected and labeled in the popup
- Path divergence to different targets is clearly visible in the tree structure
Single Target Measurements
For measurements with a single target:
- The target appears as a single node at the center of the tree
- The "Target" toggle in the toolbar controls its visibility (as well as clicking on the node itself)
- All paths converge to this single destination
DNS-Specific Features
When viewing DNS measurements, Khipu provides additional capabilities:
DNS Decoding
- Automatic decoding of DNS responses (abuf)
- Shows query types and response codes
- Displays resolver information
- Indicates DNSSEC validation status
Advanced Filtering
Once DNS decoding completes:
- Filter by specific query types (A, AAAA, etc.)
- Search for particular response codes
- Filter by resolver addresses
- Find specific domain responses
Tips for Effective Use
Analyzing Network Paths
- Start with IP view for detailed analysis
- Switch to ASN view to understand routing decisions
- Use Country view to identify geographic patterns
- Apply RTT filters to focus on performance issues
Identifying Issues
- Look for failed hops (shown in red)
- Check for routing loops or unusual paths
- Compare RTT values across different paths
- Use filters to isolate problematic measurements
Optimizing Performance
- Use country filters to reduce visual complexity
- Hide successful traces when focusing on failures
- Adjust RTT range to focus on specific latency bands
- Toggle labels on/off based on analysis and needs
Sharing and Collaboration
URL-based Configuration
Khipu automatically saves all visualisation settings in the URL, making it easy to share your exact view with others:
- All view modes, filters, and display options are encoded in the URL
- Simply copy and share the URL from your browser's address bar
- Recipients will see exactly the same visualisation configuration
- No need to manually document or explain your settings
What Gets Shared
When you share a Khipu URL, the following settings are preserved:
- Selected measurement ID and type
- Current view mode (IP, ASN, or Country)
- All active filters (RTT range, path filter, country selections)
- Display options (successful traces, labels, distance mode)
- Open/close state of country filter
- Fullscreen state
Common Use Cases
Troubleshooting Connectivity Issues
- Filter to show only failed traces
- Examine the last successful hop before failures
- Switch to ASN view to identify problematic networks
- Use path filter to find specific problem IPs or ASNs
Identifying Network Concentration Points
- Load your measurement data and switch to ASN or IP view
- Look for nodes with many converging paths (thick connection bundles)
- Hover over high-traffic nodes to see their details
- Use the path filter to isolate traces through specific concentration points
- Document critical bottlenecks for redundancy planning
Verifying Routing Policies and Prefix Acceptance
- Use the path filter to search for a specific interface or hop IP
- Filter traces that pass through your partner's network (ASN view)
- Check if your prefixes are being accepted and preferred
- Verify that expected routing paths are being used
- Compare actual paths with intended routing policies
- Document any discrepancies for configuration review
Focusing on Performance Issues
- Switch to IP view and enable RTT distance mode
- Use the RTT Range Filter to exclude well-performing traces (e.g., < 50ms)
- Focus on the remaining high-latency paths
- Identify common hops in poorly performing traces
- Switch to ASN view to see if specific networks are causing delays
- Create a prioritized list of performance bottlenecks to address
Investigating DNS Resolution
- Load DNS measurements
- Wait for automatic DNS decoding (if necessary, for large datasets)
- Use path filter to search for specific queries
- Analyze resolver distribution and response patterns
Geographic Routing Analysis
- Switch to Country view
- Enable short names for cleaner display
- Use country filter to focus on specific regions
- Identify unexpected geographic routing patterns
Other
- If the measurement is a periodic (vs one-off), you can use the time travel input at the top right of the page to view a different result (rather than the default latest result)
- You can also access a realtime results version here for quick path analysis in Atlas Use Cases