Path Analysis
Path Analysis is a visualisation tool for comparing and analysing traceroute data over time. It enables users to identify routing changes, performance degradation, and ASN/IXP transitions by comparing network paths across different time periods.
Overview
Path Analysis helps you understand how network paths evolve by providing:
- Visual comparison of traceroutes across time periods
- Automatic detection of routing changes, ASN transitions, and latency shifts
- Interactive timeline navigation for exploring changes
- Direct comparison mode for before/after analysis
Access Points
Path Analysis is available in two ways:
- Standalone: Access directly at
https://atlas.ripe.net/pathanalysis - Integrated: Currently available on the Probe Detail page under the Results tab (when opening traceroute measurements), it will be rolled out to other parts of the Atlas UI in the coming months.
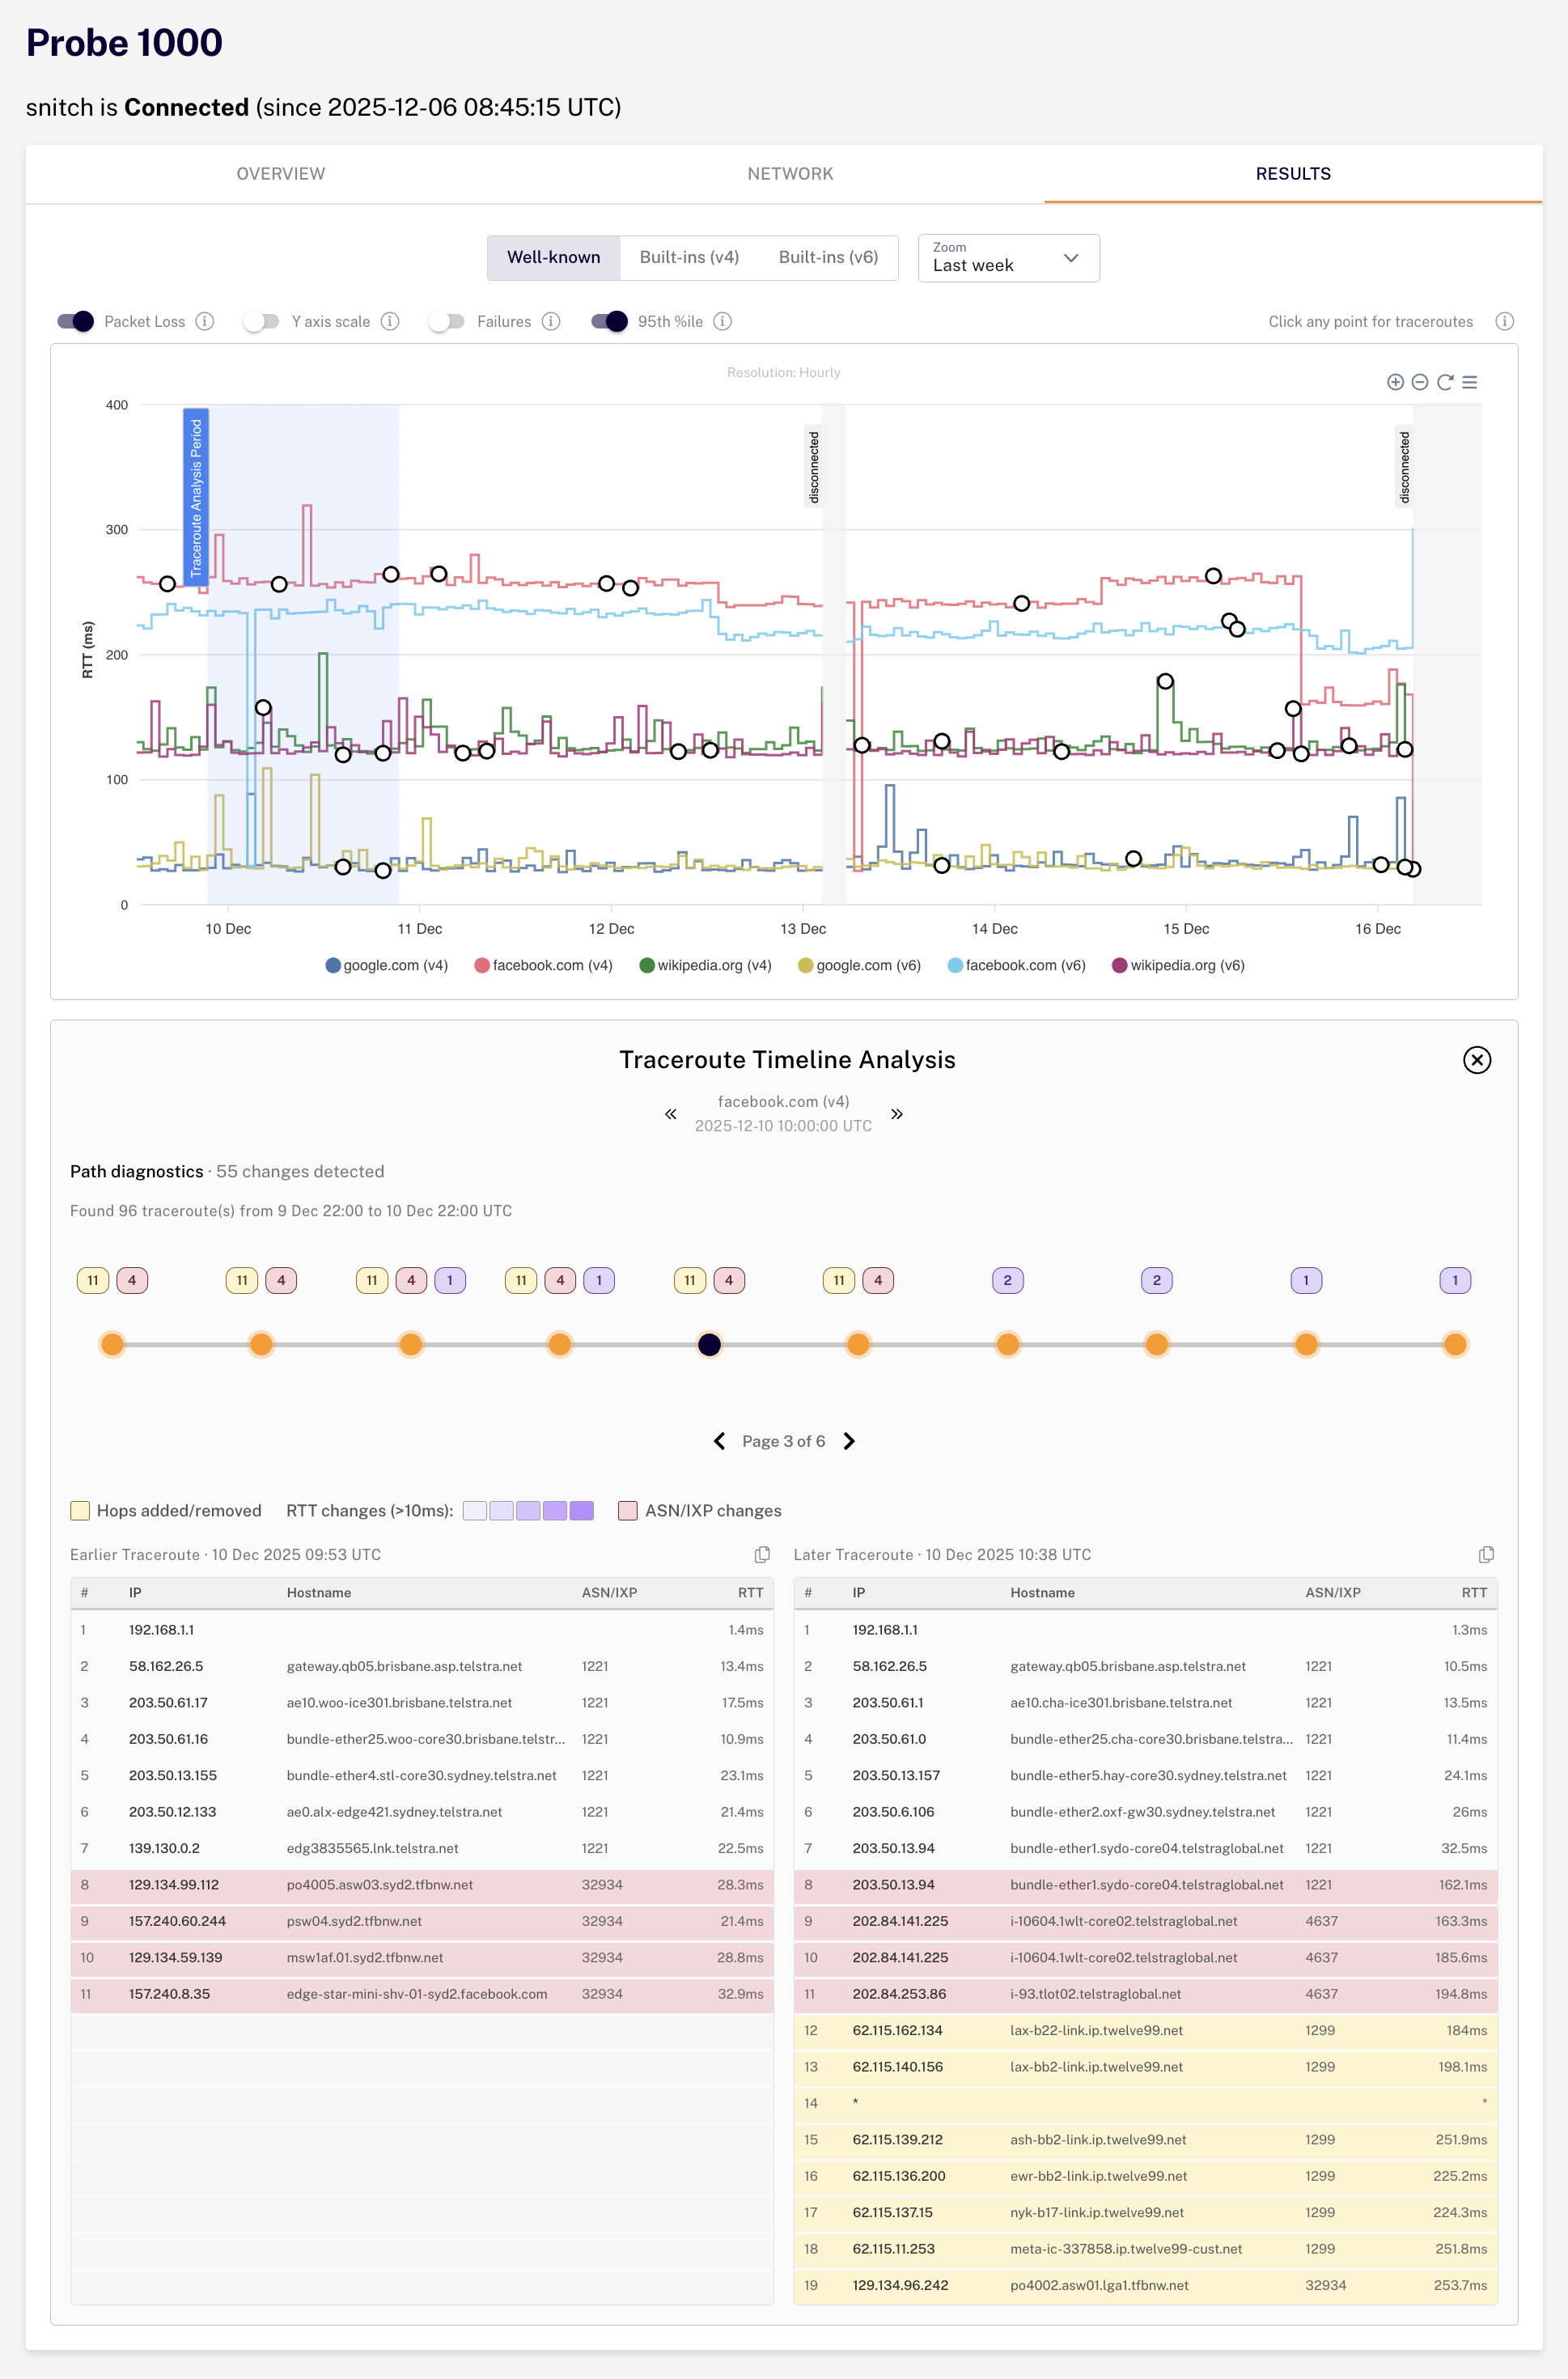 Path Analysis integrated into the Probe Detail results page
Visual Highlighting System
The tool uses colour-coded indicators to highlight differences between traceroutes:
| Colour | Indicates | Description |
|---|---|---|
| Yellow | Routing changes | Hops added or removed from the path |
| Red | ASN/IXP transitions | Different ASN or IXP at the same hop position |
| Purple | RTT degradation | Performance degradation exceeding thresholds |
 Colour legend showing yellow (routing), red (ASN), and purple (RTT) highlighting
RTT Highlighting Thresholds
Purple highlighting for RTT changes uses graduated intensity levels to indicate severity:
- Changes must exceed both 10ms and 20% difference to trigger highlighting
- Light purple: 20-40% change
- Medium purple: 40-200% change
- Dark purple: >200% change
Operating Modes
Sequential Mode
Sequential mode allows you to navigate through detected changes within a time window using an interactive timeline.
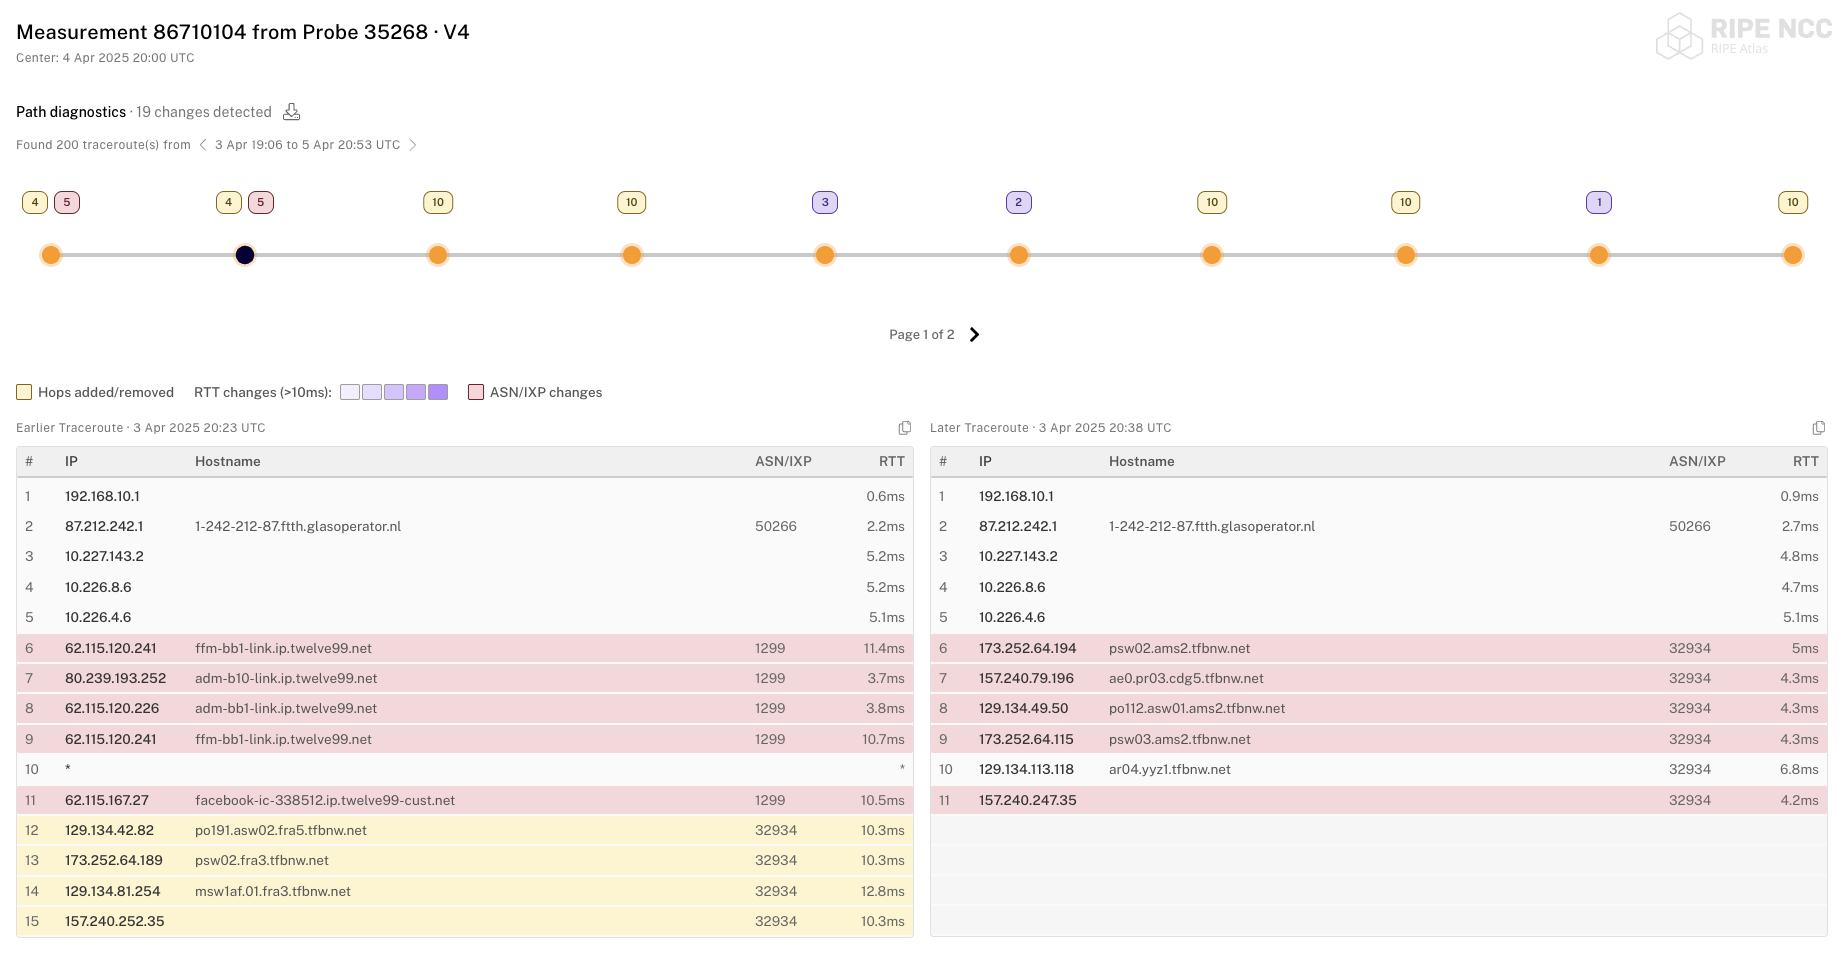 Sequential mode with timeline showing detected changes
- Each point on the timeline represents a traceroute with detected changes
- Badges on timeline points indicate the types of changes found
- Hover over timeline points to view detailed change information
- Navigate forward and backward through changes using the timeline controls
Comparison Mode
Comparison mode enables direct comparison between two specific time periods.
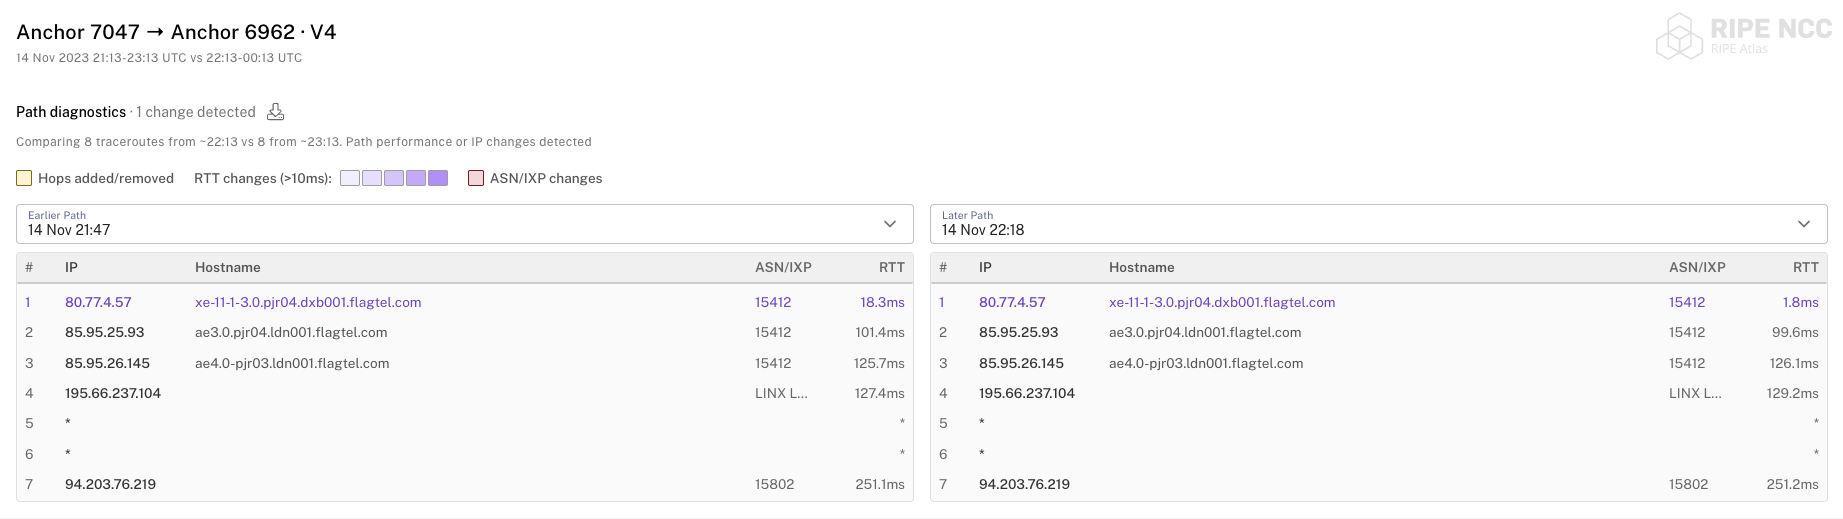 Comparison mode showing before and after traceroute pairs
- Select exact "before" and "after" time windows
- View one-to-one traceroute pairs side by side
- Useful for investigating specific incidents or maintenance windows
URL Configuration
Path Analysis supports URL parameters for sharing specific views and integrating with other tools.
Data Specification
You must provide one of the following parameter combinations:
Measurement mode (for specific measurement results):
measurementId— The RIPE Atlas measurement IDsourceProbeId— The probe ID to show results from
Anchor pair mode (for anchor-to-anchor measurements):
sourceAnchor— The source anchor IDdestinationAnchor— The destination anchor IDipVersion— IP version (4 or 6)
Time Parameters
Sequential mode parameters:
| Parameter | Required | Description |
|---|---|---|
center | Yes | Centre point of the time window (accepts milliseconds, seconds, or ISO 8601 format) |
window | Yes | Size of the time window in milliseconds |
selectedIndex | No | Pre-select a specific timeline index |
Comparison mode parameters:
| Parameter | Required | Description |
|---|---|---|
sequentialMode | Yes | Must be set to false to enable comparison mode |
earlierCenter | Yes | Centre point of the "before" time window |
earlierWindow | Yes | Size of the "before" time window in milliseconds |
laterCenter | Yes | Centre point of the "after" time window |
laterWindow | Yes | Size of the "after" time window in milliseconds |
Display Options
| Parameter | Required | Default | Description |
|---|---|---|---|
showHopChanges | No | true | Show/hide hop change highlighting |
showRttChanges | No | true | Show/hide RTT change highlighting |
showAsnChanges | No | true | Show/hide ASN/IXP change highlighting |
title | No | true | Show/hide the title bar |
timewindowNav | No | true | Show/hide the time window navigation controls |
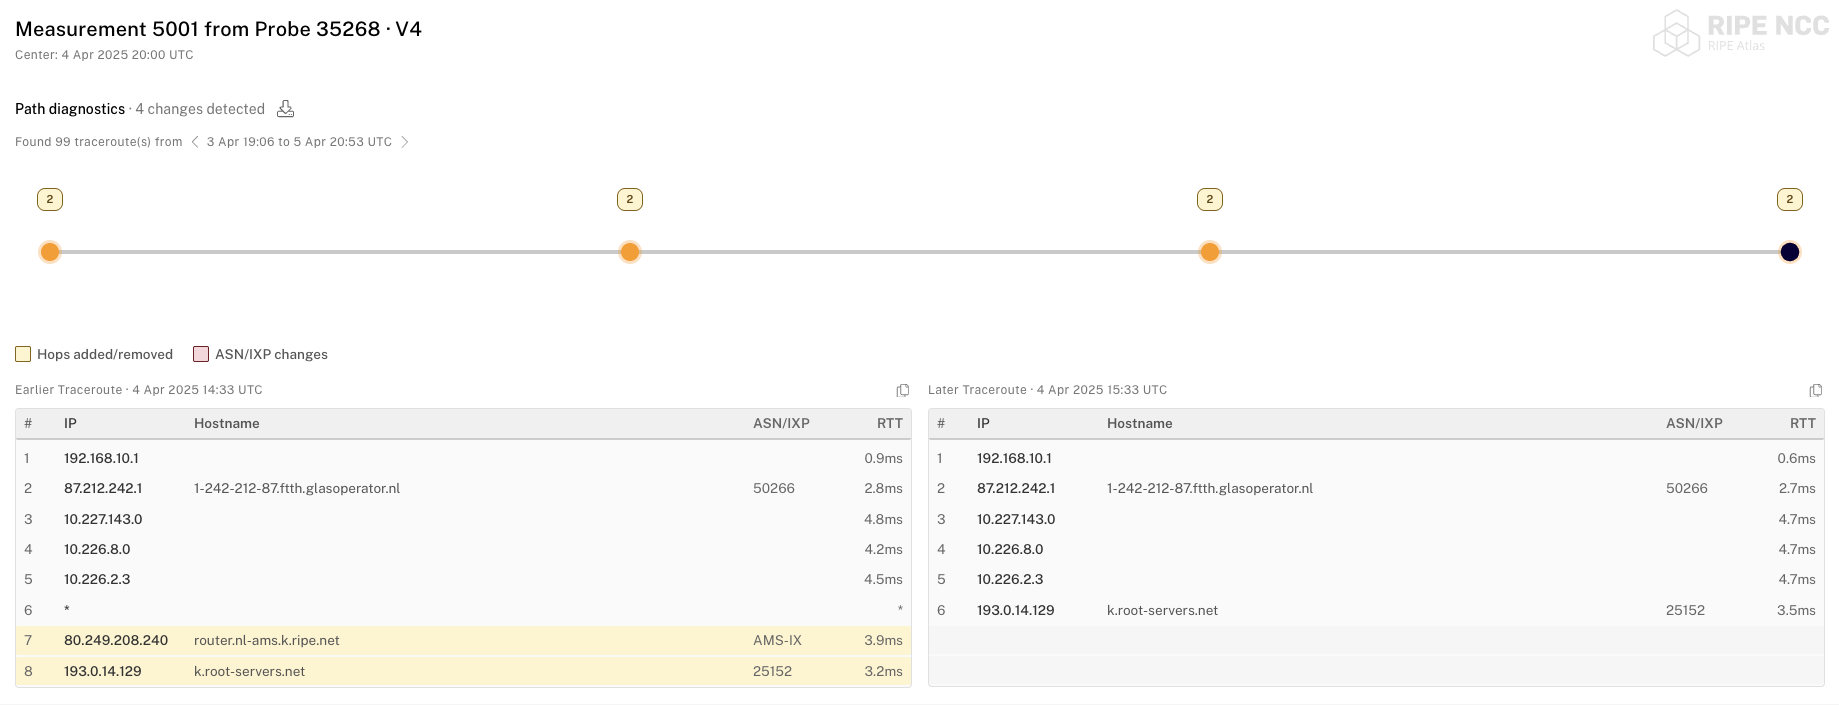 Example with
 showRttChanges=false hiding RTT degradation highlighting
Example URLs
Sequential mode with a measurement:
https://atlas.ripe.net/pathanalysis?measurementId=1234567&sourceProbeId=6789¢er=1700000000000&window=3600000Comparison mode with anchors:
https://atlas.ripe.net/pathanalysis?sourceAnchor=100&destinationAnchor=200&ipVersion=4&sequentialMode=false&earlierCenter=1699900000000&earlierWindow=3600000&laterCenter=1700000000000&laterWindow=3600000Data Export
Path Analysis provides options for exporting data:
- Download JSON (all): Export all traceroutes in the current view
- Download JSON (changes only): Export only traceroutes with detected changes
- Copy traceroute: Copy individual traceroute data for external use
Common Use Cases
Investigating Routing Changes
- Load a measurement in sequential mode
- Set a time window around the suspected change
- Navigate through the timeline to identify when routing changed
- Look for yellow highlighting indicating hop additions or removals
- Check red highlighting for ASN or IXP transitions
Analysing Performance Degradation
- Use comparison mode to compare before and after time periods
- Look for purple highlighting indicating RTT increases
- Note the intensity of purple to gauge severity
- Identify which hops are contributing to increased latency
Monitoring Anchor Connectivity
- Use anchor pair mode with source and destination anchors
- Set up regular time windows for monitoring
- Track changes over time using sequential mode
- Export data for long-term analysis and reporting