# Starting your own Measurements (User-defined Measurements)
These instructions detail how to create use and use your own measurements. These measurements are also known as "User Defined Measurements" (UDMs). To learn more about what UDMs are and how they can be used, refer to Customised Measurements (opens new window).
# The User-defined Measurements
The UDM interface is structured in three main pages: Probes, Measurements, and Credits. You will find this information is provided on the dashboard or on the probes or measurements main lists. You can create measurements as long as you have a credit balance or in certain cases for free as a RIPE NCC Member.
# Probes
The Probes page (opens new window) lists the RIPE Atlas probes that are part of the measurement network. This page is organised at the top level by two tabs: "Public", and "Mine". Under each tab are furthur ways to filter the data. Some of these tabs are only available if you are logged in.
If you are a RIPE Atlas ambassador or a RIPE Atlas sponsor, you will see these related probes on separate tabs. Above these tabs is a search field where you can search by ID, ASNs, and descriptions, and below in the table are column header filters for country, and status.
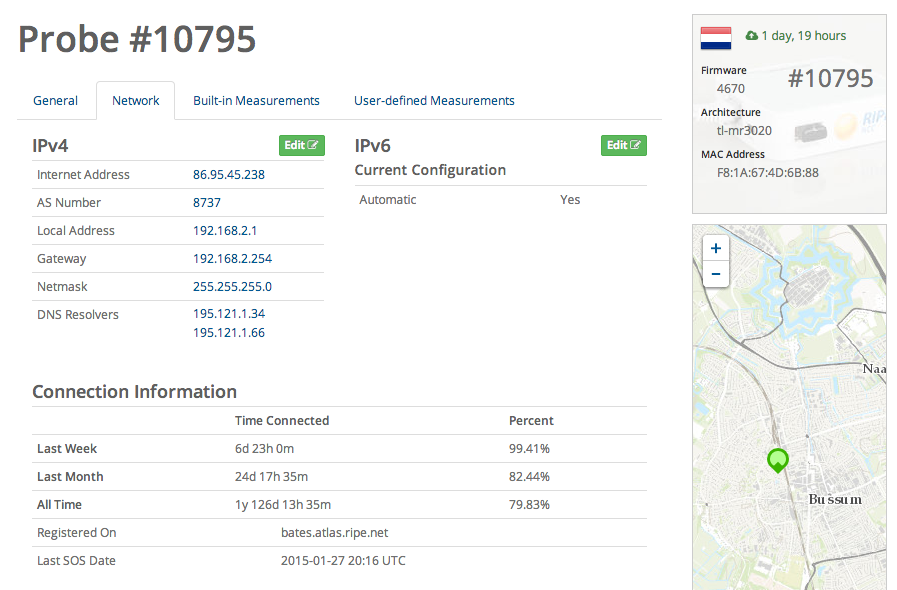
A probe status page
You can get more details about a probe by clicking on a probe's ID. Individual probe pages list uptime, network configuration, location, and the built-in and user-defined measurements in which the probe is involved.
In the case of your own probe, you will be able to edit some important configurations such as the system/user-defined tags, the location, and the network configuration (please be careful and read the related documentation before editing the network configuration).
# Measurements
The Measurements page (opens new window) allows you to see scheduled measurements and to create a new one. This page is organised at the top level by two tabs: "Public", and "Mine". Under each tab are furthur ways to filter the data. Some of these tabs are only available if you are logged in.
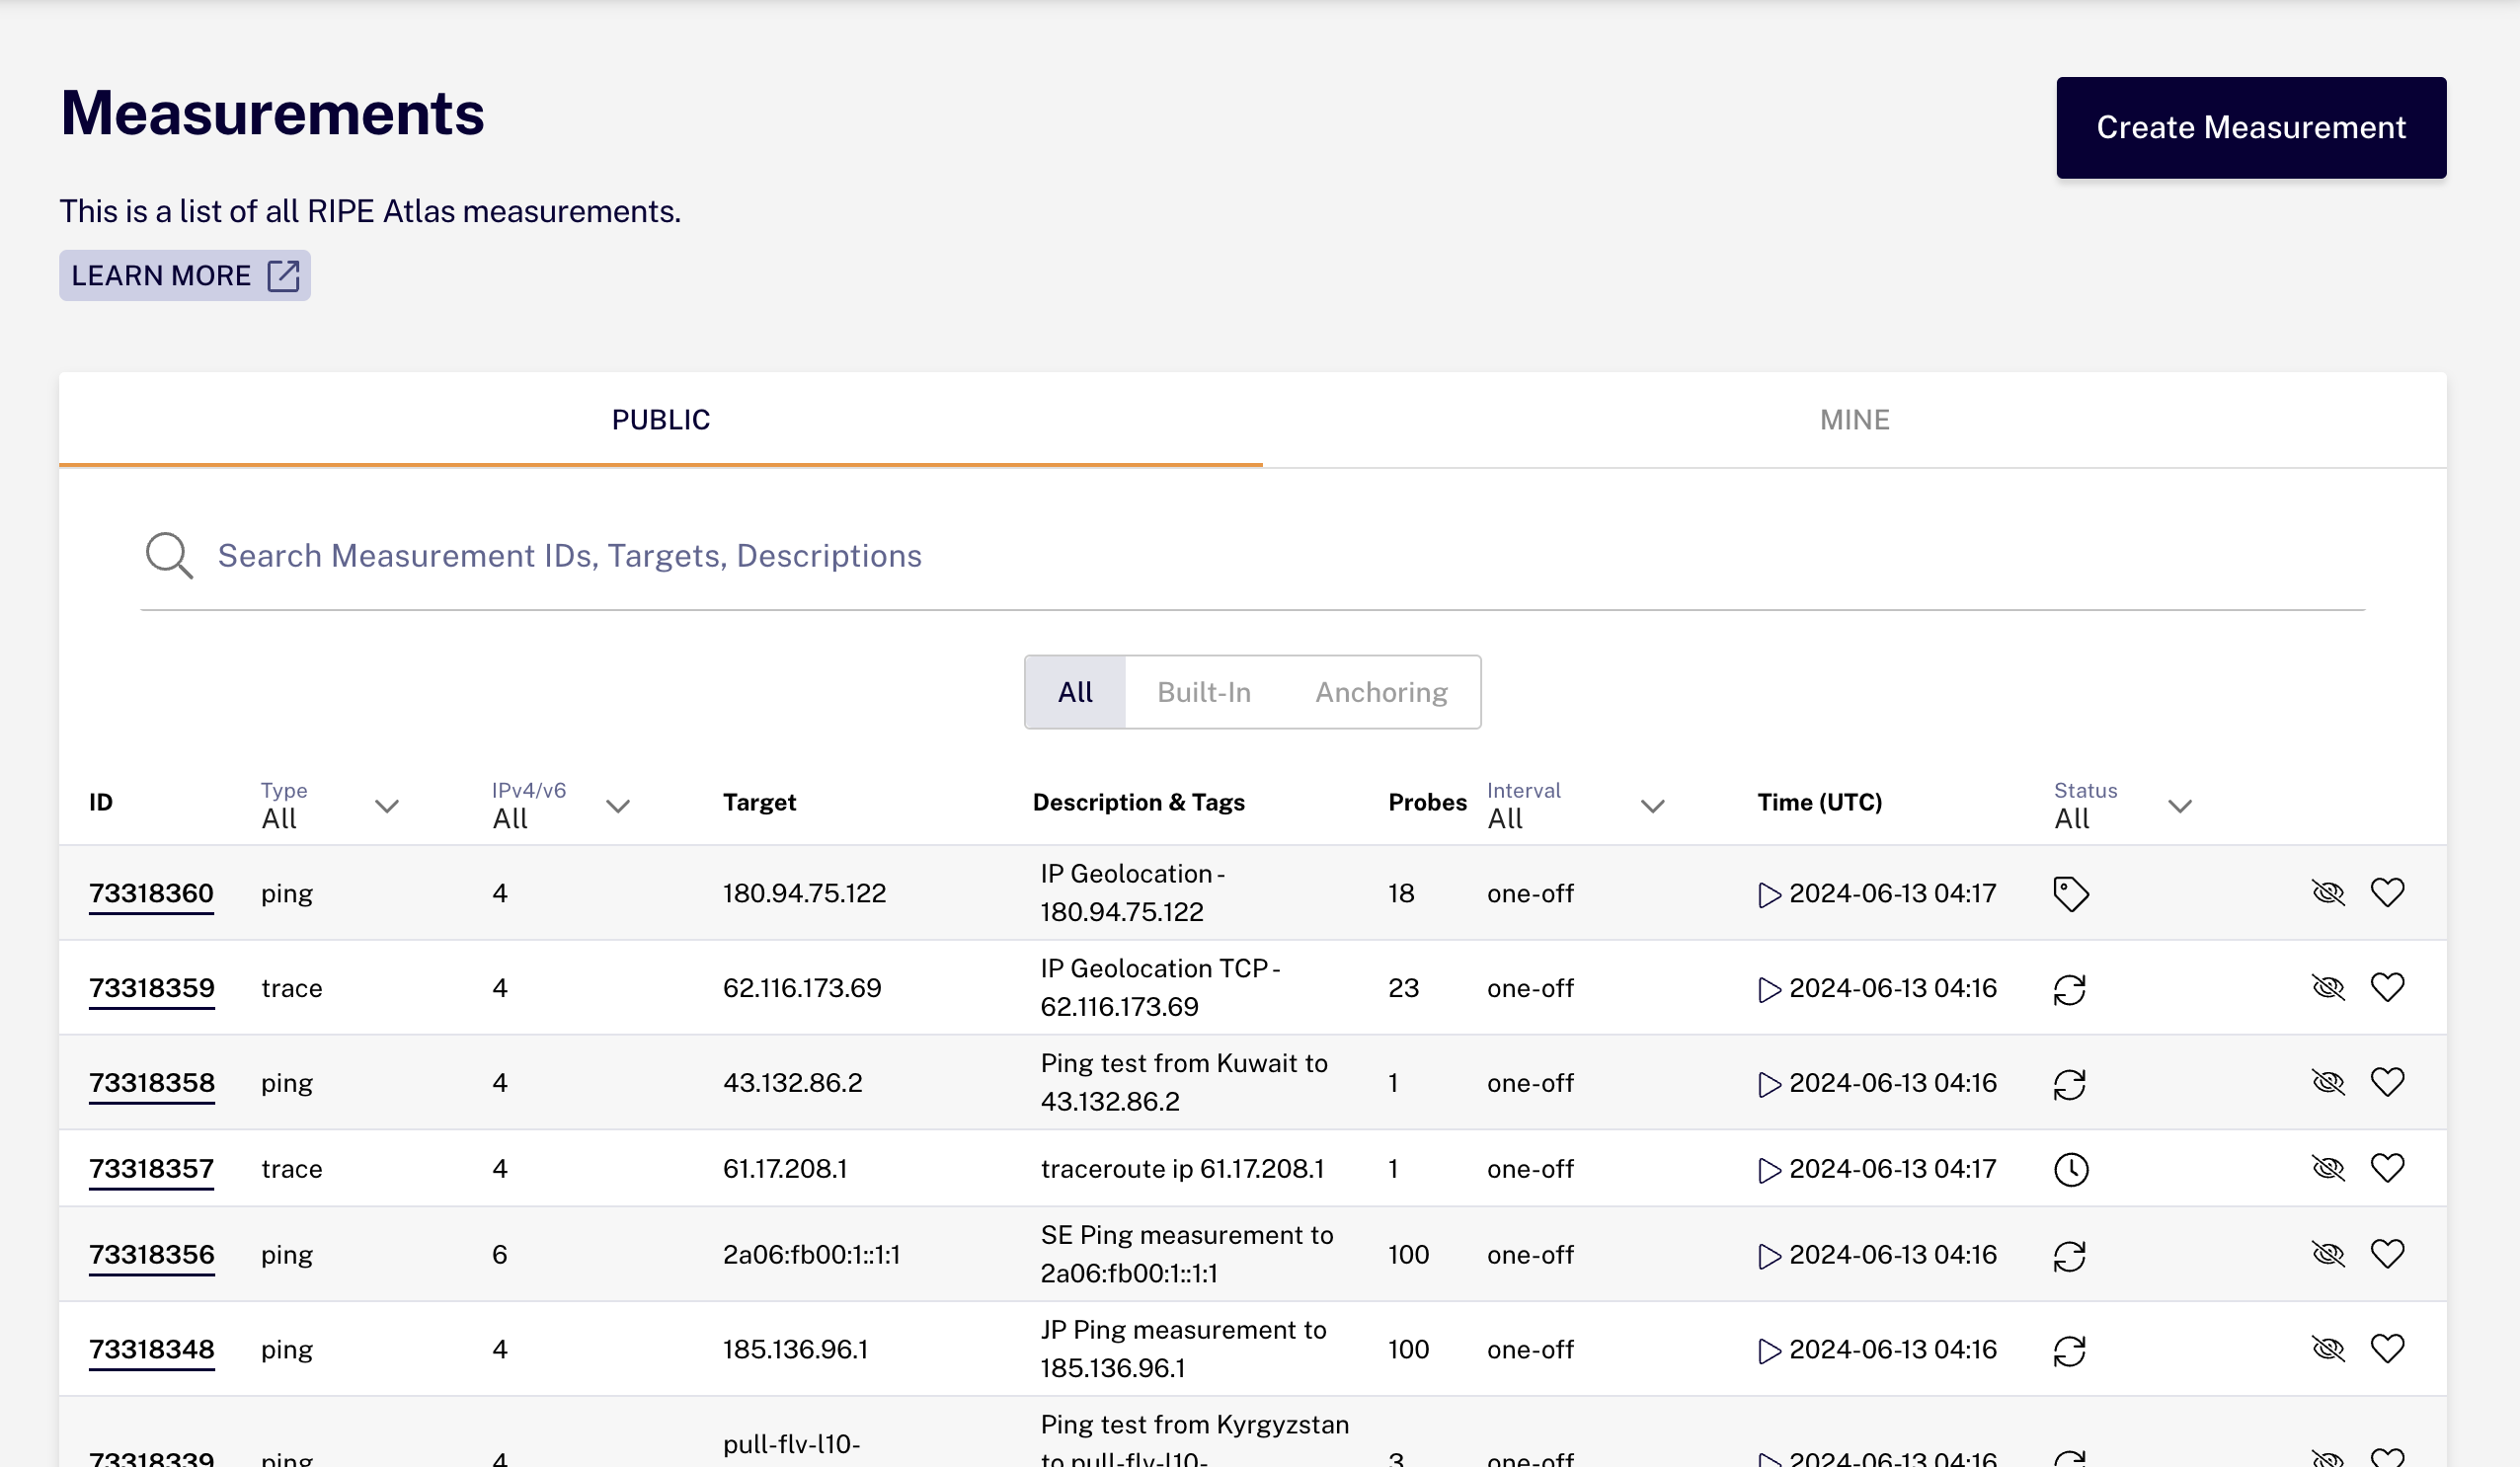
The measurements list page
The status of each measurement listed is identified by an icon, which is defined in the next section. On the upper part of the page is a search field and a set of predefined filters applicable to the measurements list.
The "Mine" section shows the user-defined measurements you have scheduled in the past.
A measurement will appear under "Favourites" if you marked it by clicking on its star icon.
From this page you can view a measurement by clicking on one of the measurement IDs or create a new measurement by clicking on the large button on the upper right part of the page.
# Statuses
Each measurement has a status, defined as one of these:
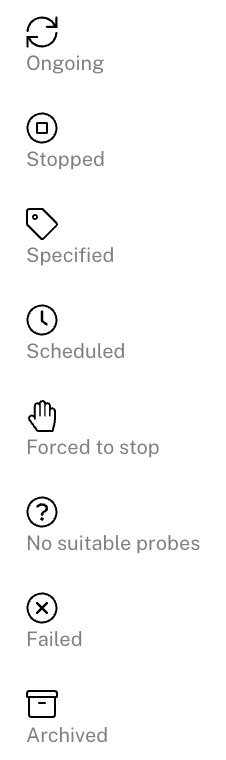
Specified: The measurement has been defined and sent to our infrastructure to be relayed to the probesScheduled: The measurement has been relayed to the probes. If the start time is immediate, this status doesn't last very longOngoing: The measurement is running on available probesStopped: The measurement was stopped either on schedule or by the user requesting an early stopForced to Stop: The measurement was killed prematurely due to a lack of available creditsNo suitable probes: The measurement cannot or could not be executed due to a lack of available probes. This may be because you asked to use probes that don't exist (for example, probes in an AS where there are no probes) or because the probes you requested were too busy to take on new jobs. This latter scenario is very rare howeverFailed: If a probe never actually runs a single measurement over the duration of the specified start/stop time (typically due to a lack of available probes), it will be marked asFailedonce the stop time has been reached
In other words, Specified, Scheduled, Ongoing, and No suitable probes are statuses potentially assigned to running measurements (or at least those who may return results at some point), while Stopped, Forced to Stop, and Failed are assigned to measurements that will not be returning any more results.
# Creating a New Measurement
On the "Create a New Measurement" page (opens new window), a wizard will guide you through the creation of a new set of measurements.
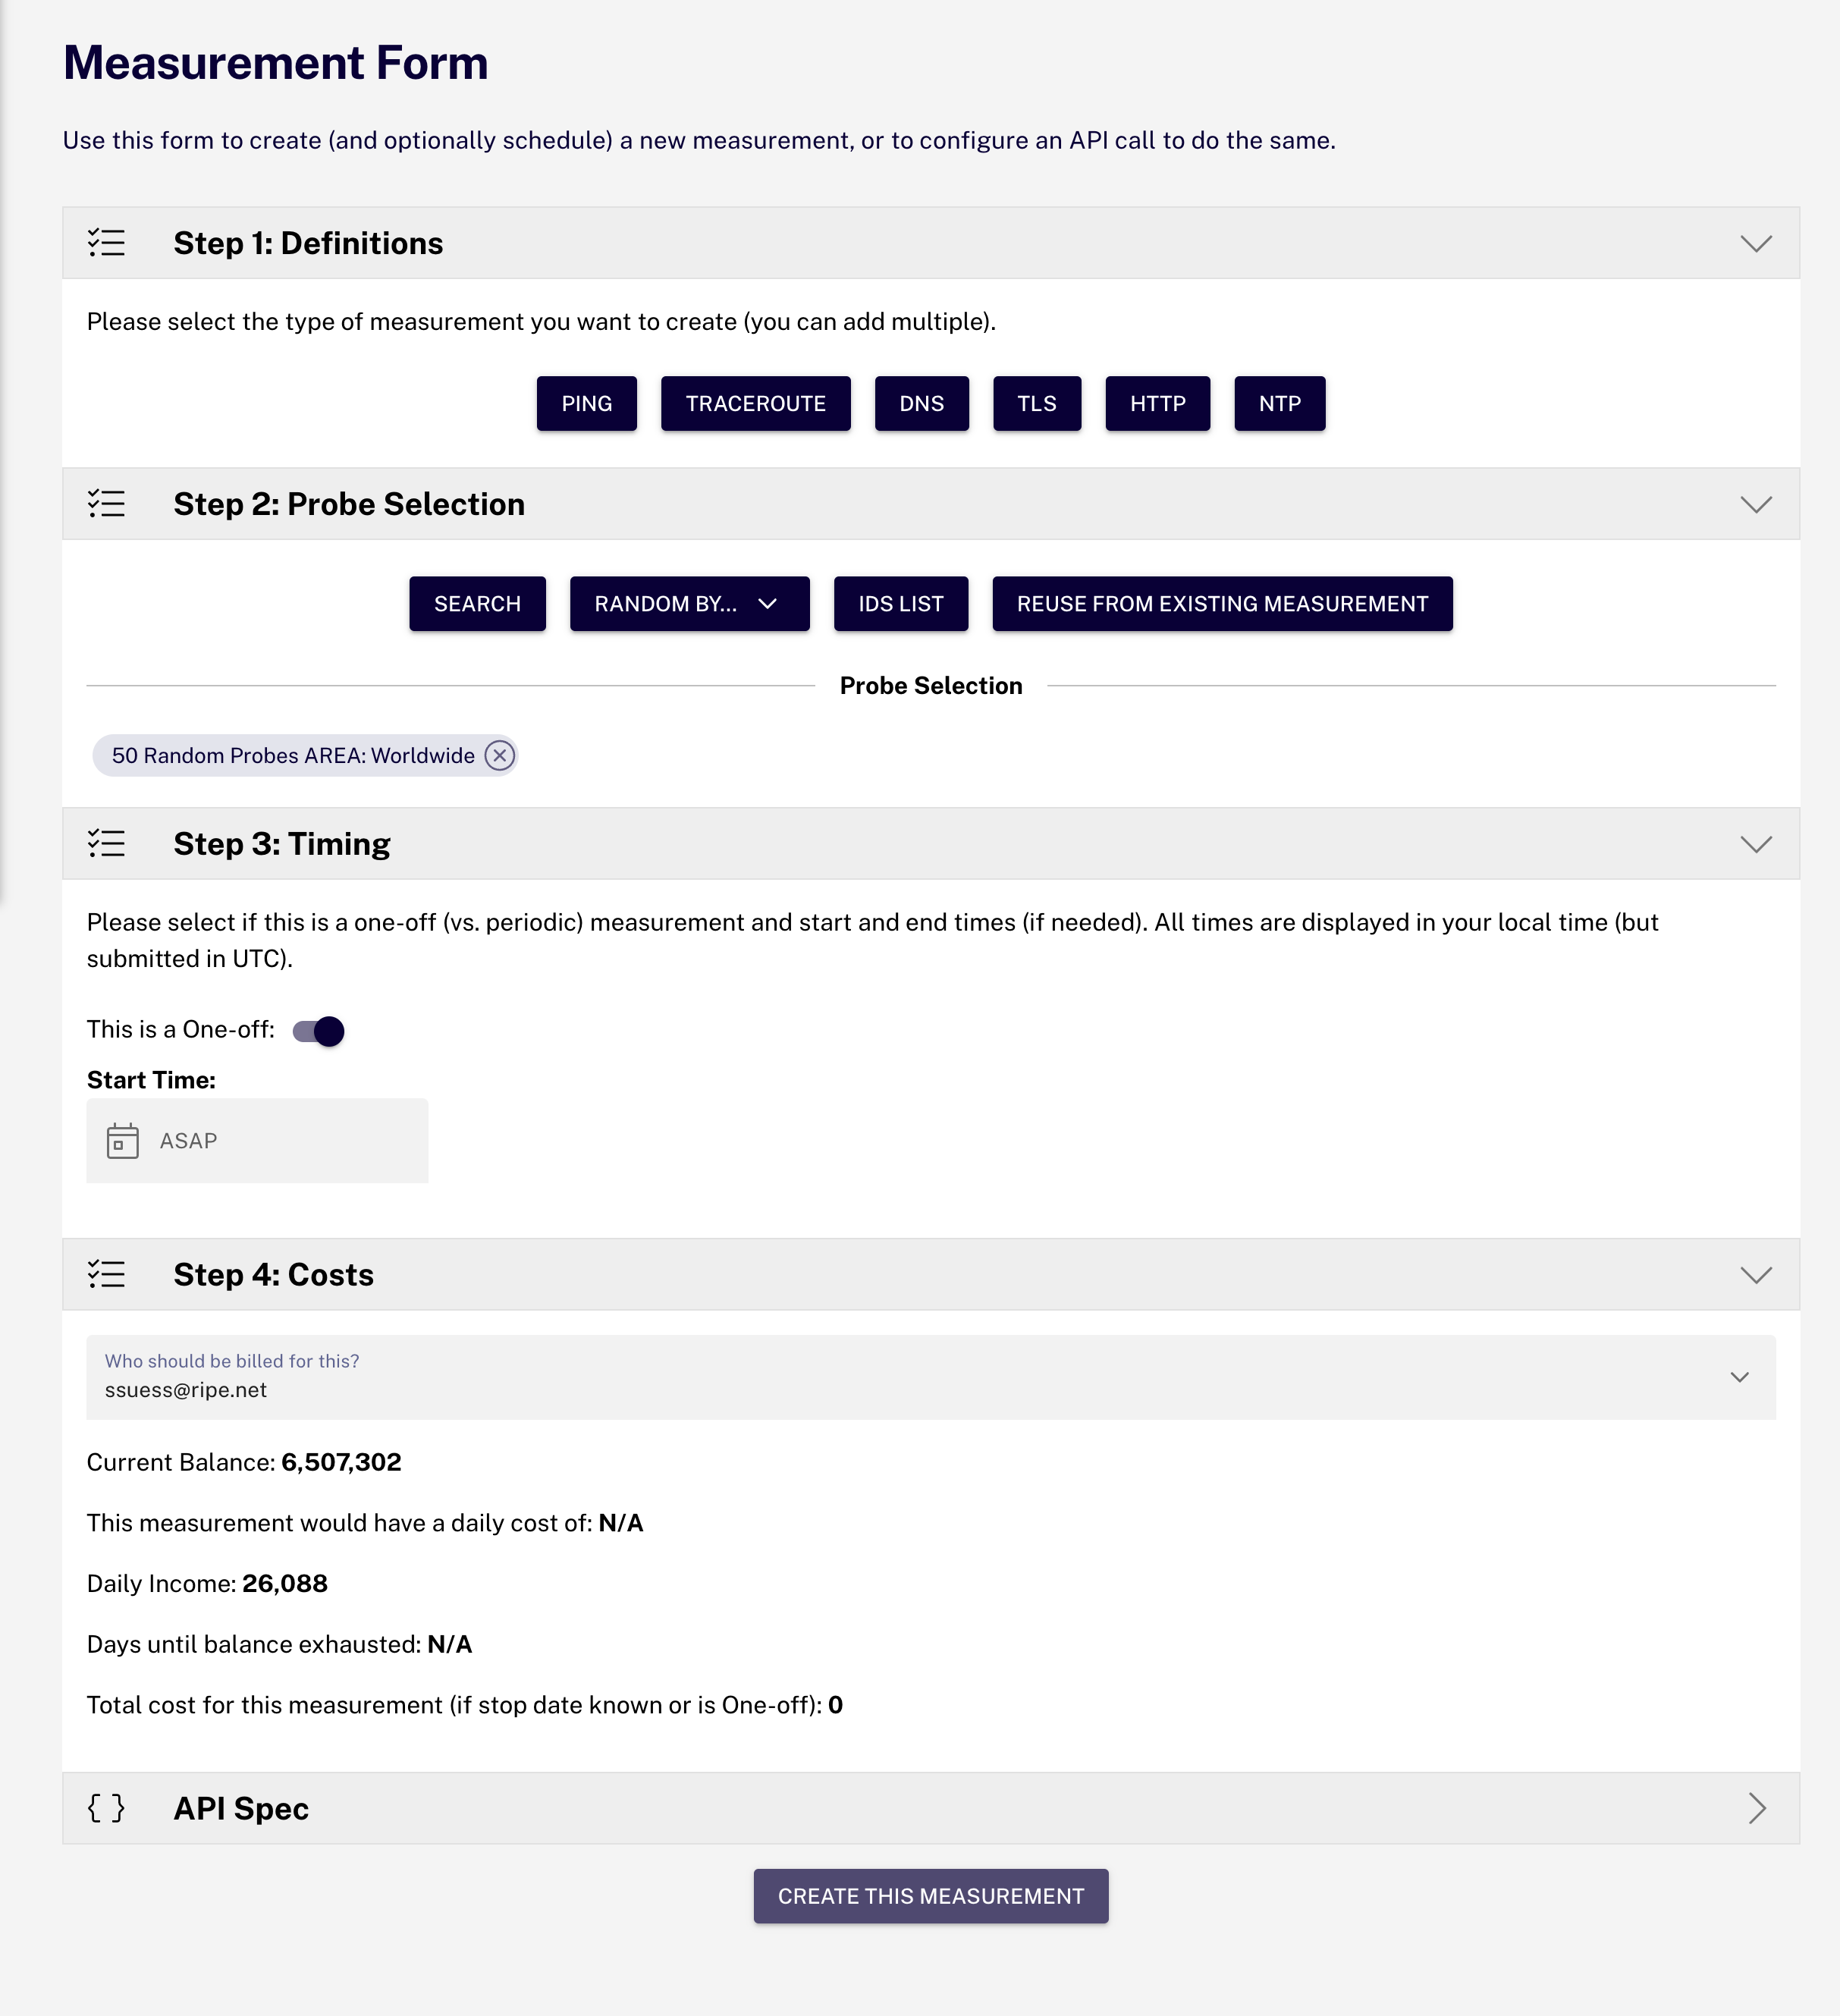
The measurements creation page
The creation process consists of three main steps: Definitions, Probe selection and Timing. In the definitions section, you can select the types of measurements you would like to schedule, with the UI showing some configurable parameters, such as the target.
A panel below these steps shows you a real-time estimate and projection about the cost of the measurement you're trying to create. It's also where you can select who results will be "billed to", if you have authorisation.
Finally, an extra panel at the bottom of the page shows you the real-time, API-compatible specification, which can be used to learn how to create measurements directly through the API.
The measurement creation form suggests sensible default values, allowing you to create a measurement with just three clicks by selecting type, specifying the target and submitting the form.
You need to have sufficient credits to create a measurement. If you try to create a new measurement but do not have enough credits, or you have exceeded the quotas, you will not be able to create a new measurement. In addition, a never-ending measurement will no longer be updated with new results if your credit balance reaches and remains at zero.
# Definitions
The available measurement types are "Ping", "Traceroute", "DNS", "SSL" (TLS) and "NTP". "HTTP" measurements are also technically possible but are restricted to researchers and other interested users on a case-by-case basis (see Special Requests, below).
You add measurements by clicking the type of measurement you wish to create. It is possible to create different types of measurements at the same time.
Basic fields, common to all measurement types, include "Target" and "Resolve on probe".
The target is the remote host probes will try to measure. It should be specified as a hostname or IP address. Note that, for DNS measurements, the target refers to the resolver that will be used, not the host the resolver will attempt to resolve (known as the argument).
If a hostname was specified as the 'Target', resolving the hostname into an IP address can be done by the RIPE Atlas back-end, or by each probe. Checking the 'Resolve on probe' box enables probe-side checking.
Here is a list of measurement types and some related parameters. (Note that some fields are contained under "Advanced Options" and you must click on this link to reveal them.)
# Ping
- Address Family - Select whether you want to use IPv4 or IPv6
- Packets - The number of packets that should be sent in each ping
- Size - The size of the packets that are sent
- Description - Allows you to give the measurement a description to help you identify it
- Interval - The number of seconds each probe participating in the measurement will wait before attempting to perform the measurement again. A drop-down list will suggest some common options
- Spread ??? This distributes the start time of the probes??? measurements throughout the interval so that they are more evenly spaced. If spread is not specified, it will default to half of the interval, with a maximum of 400 seconds
# Traceroute
- Address Family - select whether you want to use IPv4 or IPv6.
- Timeout - This option is the maximum time, in milliseconds, to wait for a response
- Interval - The number of seconds each probe participating in the measurement will wait before attempting to perform the measurement again
- Spread ??? This distributes the start time of the probes??? measurements throughout the interval so that they are more evenly spaced. If spread is not specified, it will default to half of the interval, with a maximum of 400 seconds
- Description - Allows you to give the measurement a description to help you identify it
- Protocol - This specifies the protocol to use, either UDP or ICMP. More information about these protocols as they relate to traceroute can be found on Wikipedia (opens new window)
- Packets - The number of packets that should be sent in each traceroute
- Size - The size of the packet
- First Hop - This is the initial value for the time-to-live counter
- Destination Extension Header Size - The size of the destination extension header to include in the IPv6 packet
- Port - Destination port for TCP traceroute
- Paris - A number greater than 0 will indicate the number of variations to be used for a Paris traceroute (opens new window). Setting the value to 0 makes the measurement use the standard traceroute
- Maximum Hops - This is the final value for the time-to-live counter
- Hop-by-Hop Extension Header Size - The size of the hop-by-hop extension header to include in the IPv6 packet
- Don't Fragment - Enabling this option avoids fragmentation for outgoing packets. Read about fragmentation (opens new window)
# DNS
- Address Family - Select whether you want to use IPv4 or IPv6
- Query Class - Specify if the query will be performed in the IN or CHAOS domain space
- Query Type - The type of DNS query to perform
- Query Argument - The domain name (or IP address, in the case of reverse DNS) to look up
- Description - Allows you to give the measurement a description to help you identify it
- Interval - The number of seconds each probe participating in the measurement will wait before attempting to perform the measurement again
- Spread ??? This distributes the start time of the probes??? measurements throughout the interval so that they are more evenly spaced. If spread is not specified, it will default to half of the interval, with a maximum of 400 seconds
- Set DNSSEC OK Flag - Enable DNSSEC DO bit as per RFC-3225 (opens new window)
- Recursion desired - Enable recursion. This is the RD flag described in RFC1035
- Use Probe's Resolver - Ese the probe's list of local resolvers instead of specifying a target to use as the resolver
- Protocol - The protocol to use
- Retry Times - Number of attempts
- UDP Payload Size - The maximum reply size accepted. This field is described in RFC2671 (opens new window)
- Include the Qbuf - Include a base64 encoded version of the queries made by the probe
- Exclude the Abuf - Exclude the full base64 encoded answer
- Prepend the Probe's ID - Each probe prepends its probe number and a timestamp to the DNS query argument to make it unique
- Use NSID - Include DNS nameserver identifier option as per RFC5001 (opens new window)
# TLS (SSL)
- Address Family - Select whether you want to use IPv4 or IPv6
- Port - The TCP port of the server. The default is the same as the default for HTTPS servers: port 443
- Description - Allows you to give the measurement a description to help you identify it
- Interval - The number of seconds each probe participating in the measurement will wait before attempting to perform the measurement again
- Spread ??? This distributes the start time of the probes??? measurements throughout the interval so that they are more evenly spaced. If spread is not specified, it will default to half of the interval, with a maximum of 400 seconds
# Spread
Spread can be set under ???Advanced Options??? in Step 1 when creating a new measurement using the web interface, and is also available via the API. Spread creates a distribution of individual measurements throughout the measurement interval, rather than clustering the measurements as closely together as possible. In this way, spread helps to avoid overloading targets with bursts of measurements and creates a more steady flow of packets.
For example, if you use 60 probes for a measurement that is scheduled to take place every 240 seconds without any spread, all 60 probes would perform their measurement at nearly the same time, every 240 seconds.
With a spread of 240 seconds, the probes will be assigned random start times throughout each interval. In this example, this would average out to one measurement every four seconds. The fewer the number of probes, the less uniform the distribution will be throughout the interval, since the probes are distributed randomly. However, the probes will stick to the specified frequency, so their distribution will remain the same from one interval to the next.
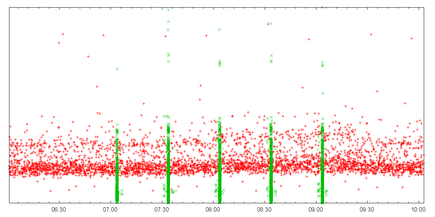
Interval control in action. The x-axis is the time of measurement and dots are individual results. The green dots correspond to a frequency of 1,800s and a spread of 30s, while red dots correspond to a frequency of 3,600s and a spread of 3,600s.
# Probe selection
The second step of the wizard helps select the probes that will participate in the UDM. By default, 50 probes worldwide are randomly selected, allowing you to skip this step if you like.
You can specify a set of probes already used in a previously scheduled measurement or a new set of probes, either manually or through the probe selection wizard. The selections are displayed in an editable list.
# Search on Map
You can select probes by searching on a map. You can zoom in and out, add and remove individual probes, or hold the shift key and draw a rectangle to select all probes in that rectangle.
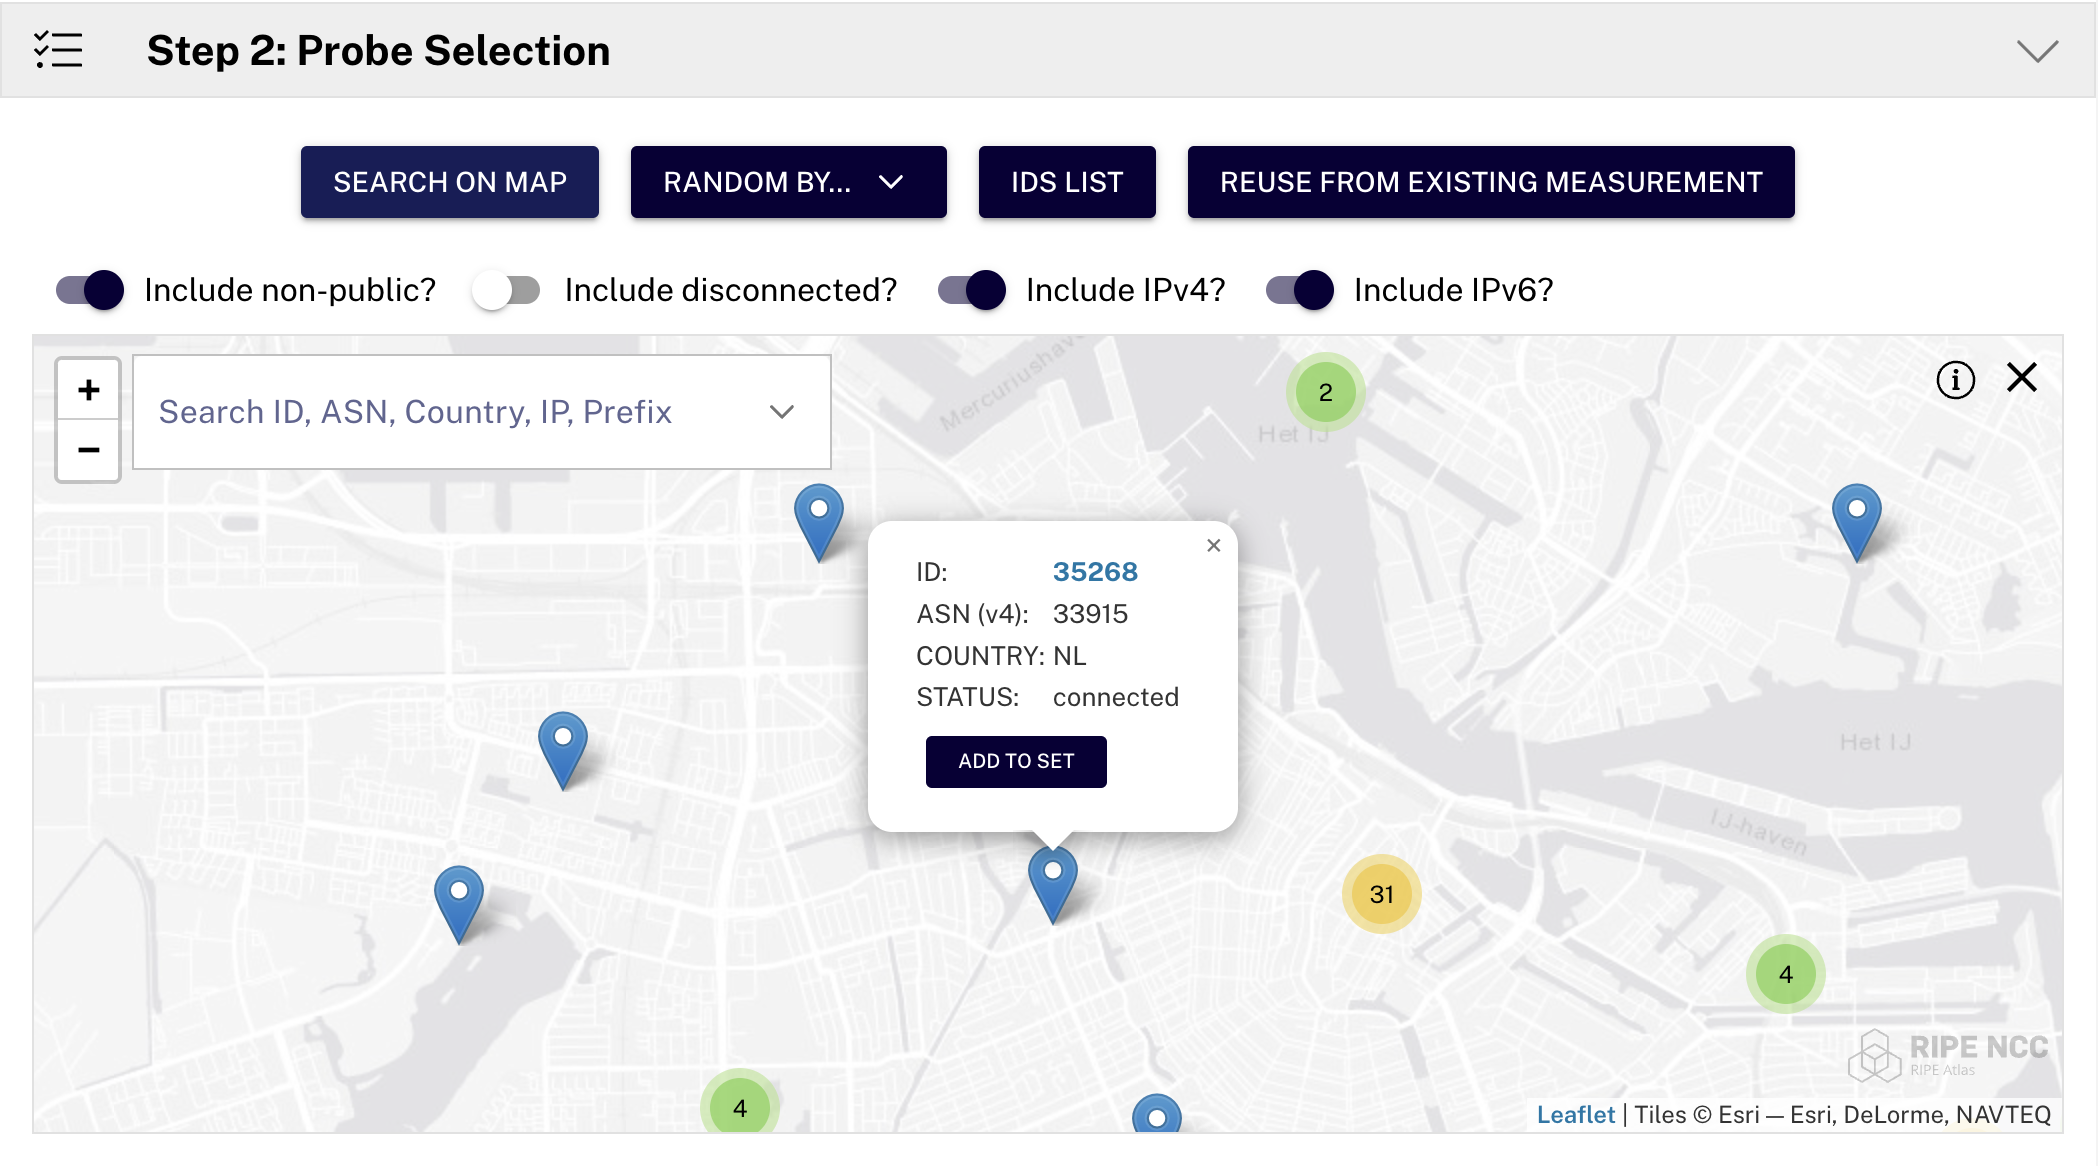
Search on Map
To make a selection, just type in what you are looking for in the search field and the map will try to find what you were looking for. You can search by numerous criteria such as Probe ID, ASN, Country, IP and Prefix. The map shows the geographical position of the selected probes in real time. For example, by searching for "Canada" the map will show all the probes in Canada.
The probes on the map are clustered, but you can adjust the zoom level to see all of them individually. By clicking on a probe on the map you can get more information, including its status. On the left of the map there are additional selection tools, including the radius selector, which allows you to select all probes within a certain radius of a specified location.
# Random by...
By clicking on the "Random by..." button you can select a random grouping of probes by area, country, prefix, or ASN.
| Area name | Top left latitude, longitude | Bottom-right latitude, longitude |
|---|---|---|
| WW | 90, -180 | -90, 180 |
| South-East | 45, 45 | -90, 180 |
| North-East | 90, 45 | 45, 180 |
| South-Central | 30, -30 | -90, 45 |
| North-Central | 90, -30 | 30, 45 |
| West | 90, -180 | -90, 30 |
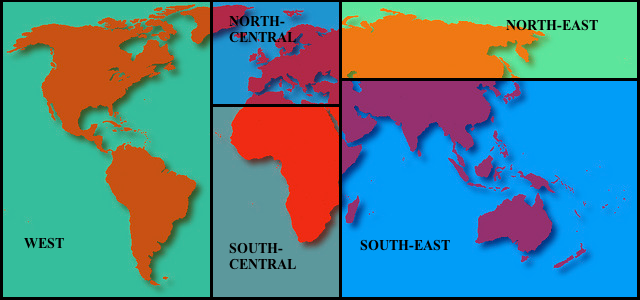
Areas used in RIPE Atlas measurements sources
When you use the "Random by" selection you will also have some additional selection steps. For example, you may select the number of probes or the types of probe tags to include or exclude. Probe tags allow you to additionally filter probes based on system/user-defined tags. The system tags are suggested by an autocompletion system.
# Type and values
The available types are: Area, Country, Prefix, and ASN:
Area: Select from a list of pre-defined areas of the world. See the map above for the available areasCountry: Select probes in a specified country. The values are expressed as two-letter ISO country codesPrefix: Select probes from within a specific prefix. You'll have to type the prefix into the mandatory fieldASN: Lets you choose probes based on which AS Number their addresses originate
# Number of probes
Allows you to specify how many probes you want from within the area you have selected.
# Include / exclude tag
Each probe can have different tags associated with it either by the host or by the RIPE Atlas system itself (these always begin with "system"). In the probe selection you can filter the list of applicable probes by either requesting probes that are tagged with or without a particular tag.
# IDs list
Sometimes you just have an arbitrary list of probe IDs you want to use. Clicking on the "IDs List" button allows you to manually select probes by entering one or more probe ids. Once you have entered them, clicking enter or tab will turn them into a chip that displays their country flag and connected status.
IMPORTANT
Specifying a probe ID does not guarantee that it will be used in your measurement. Your selected probe(s) may be disconnected from our network at the time of scheduling, or they may simply be too busy to handle additional measurements. In most cases, the requested probe(s) will be rolled into the measurement, but you should not assume this to be the case 100% of the time.
# Reuse a set from a existing measurement
Clicking on this button will bring up a dialog allowing you to search for previous measurements by their ID or description. An auto suggestion system will help you find the measurement. When a measurement is selected, the system will add the probes from this measurement to your current selection set.
# Timing
The third section of the measurement form allows you to select the measurement's start and stop times. The fields are Start and End time. You can also specify whether it is a One-off measurement.
# One-off
One-off measurements, as the name suggests, execute only once. They are near real time; results are delivered a few seconds (generally 8-10) after specifying the measurement. This makes one-offs an ideal tool for looking into network problems that are perceived "now". If this option is selected, you can specify only the Start time.
# Start
For the measurement start time, you can choose between 'as soon as possible' (ASAP) or a specific date and time (in UTC).
# End
The measurement's end time can be 'never' (which means it won't stop until you manually stop it or run out of credits) or a specific date and time (in UTC).
Once your measurement is submitted and accepted, you can immediately see it in your measurement list and can check its results. (A green confirmation banner with clickable id(s) will appear at the top after you successfully submit your measurement)
# Viewing a measurement
After you click on a measurement ID, a new page shows you all the details about the selected measurement. The page is divided into tabs with various functions, some of which you will only see depending on whether you are logged in, whether the measurement is periodic or one-off, and whether the measurement is owned by you.
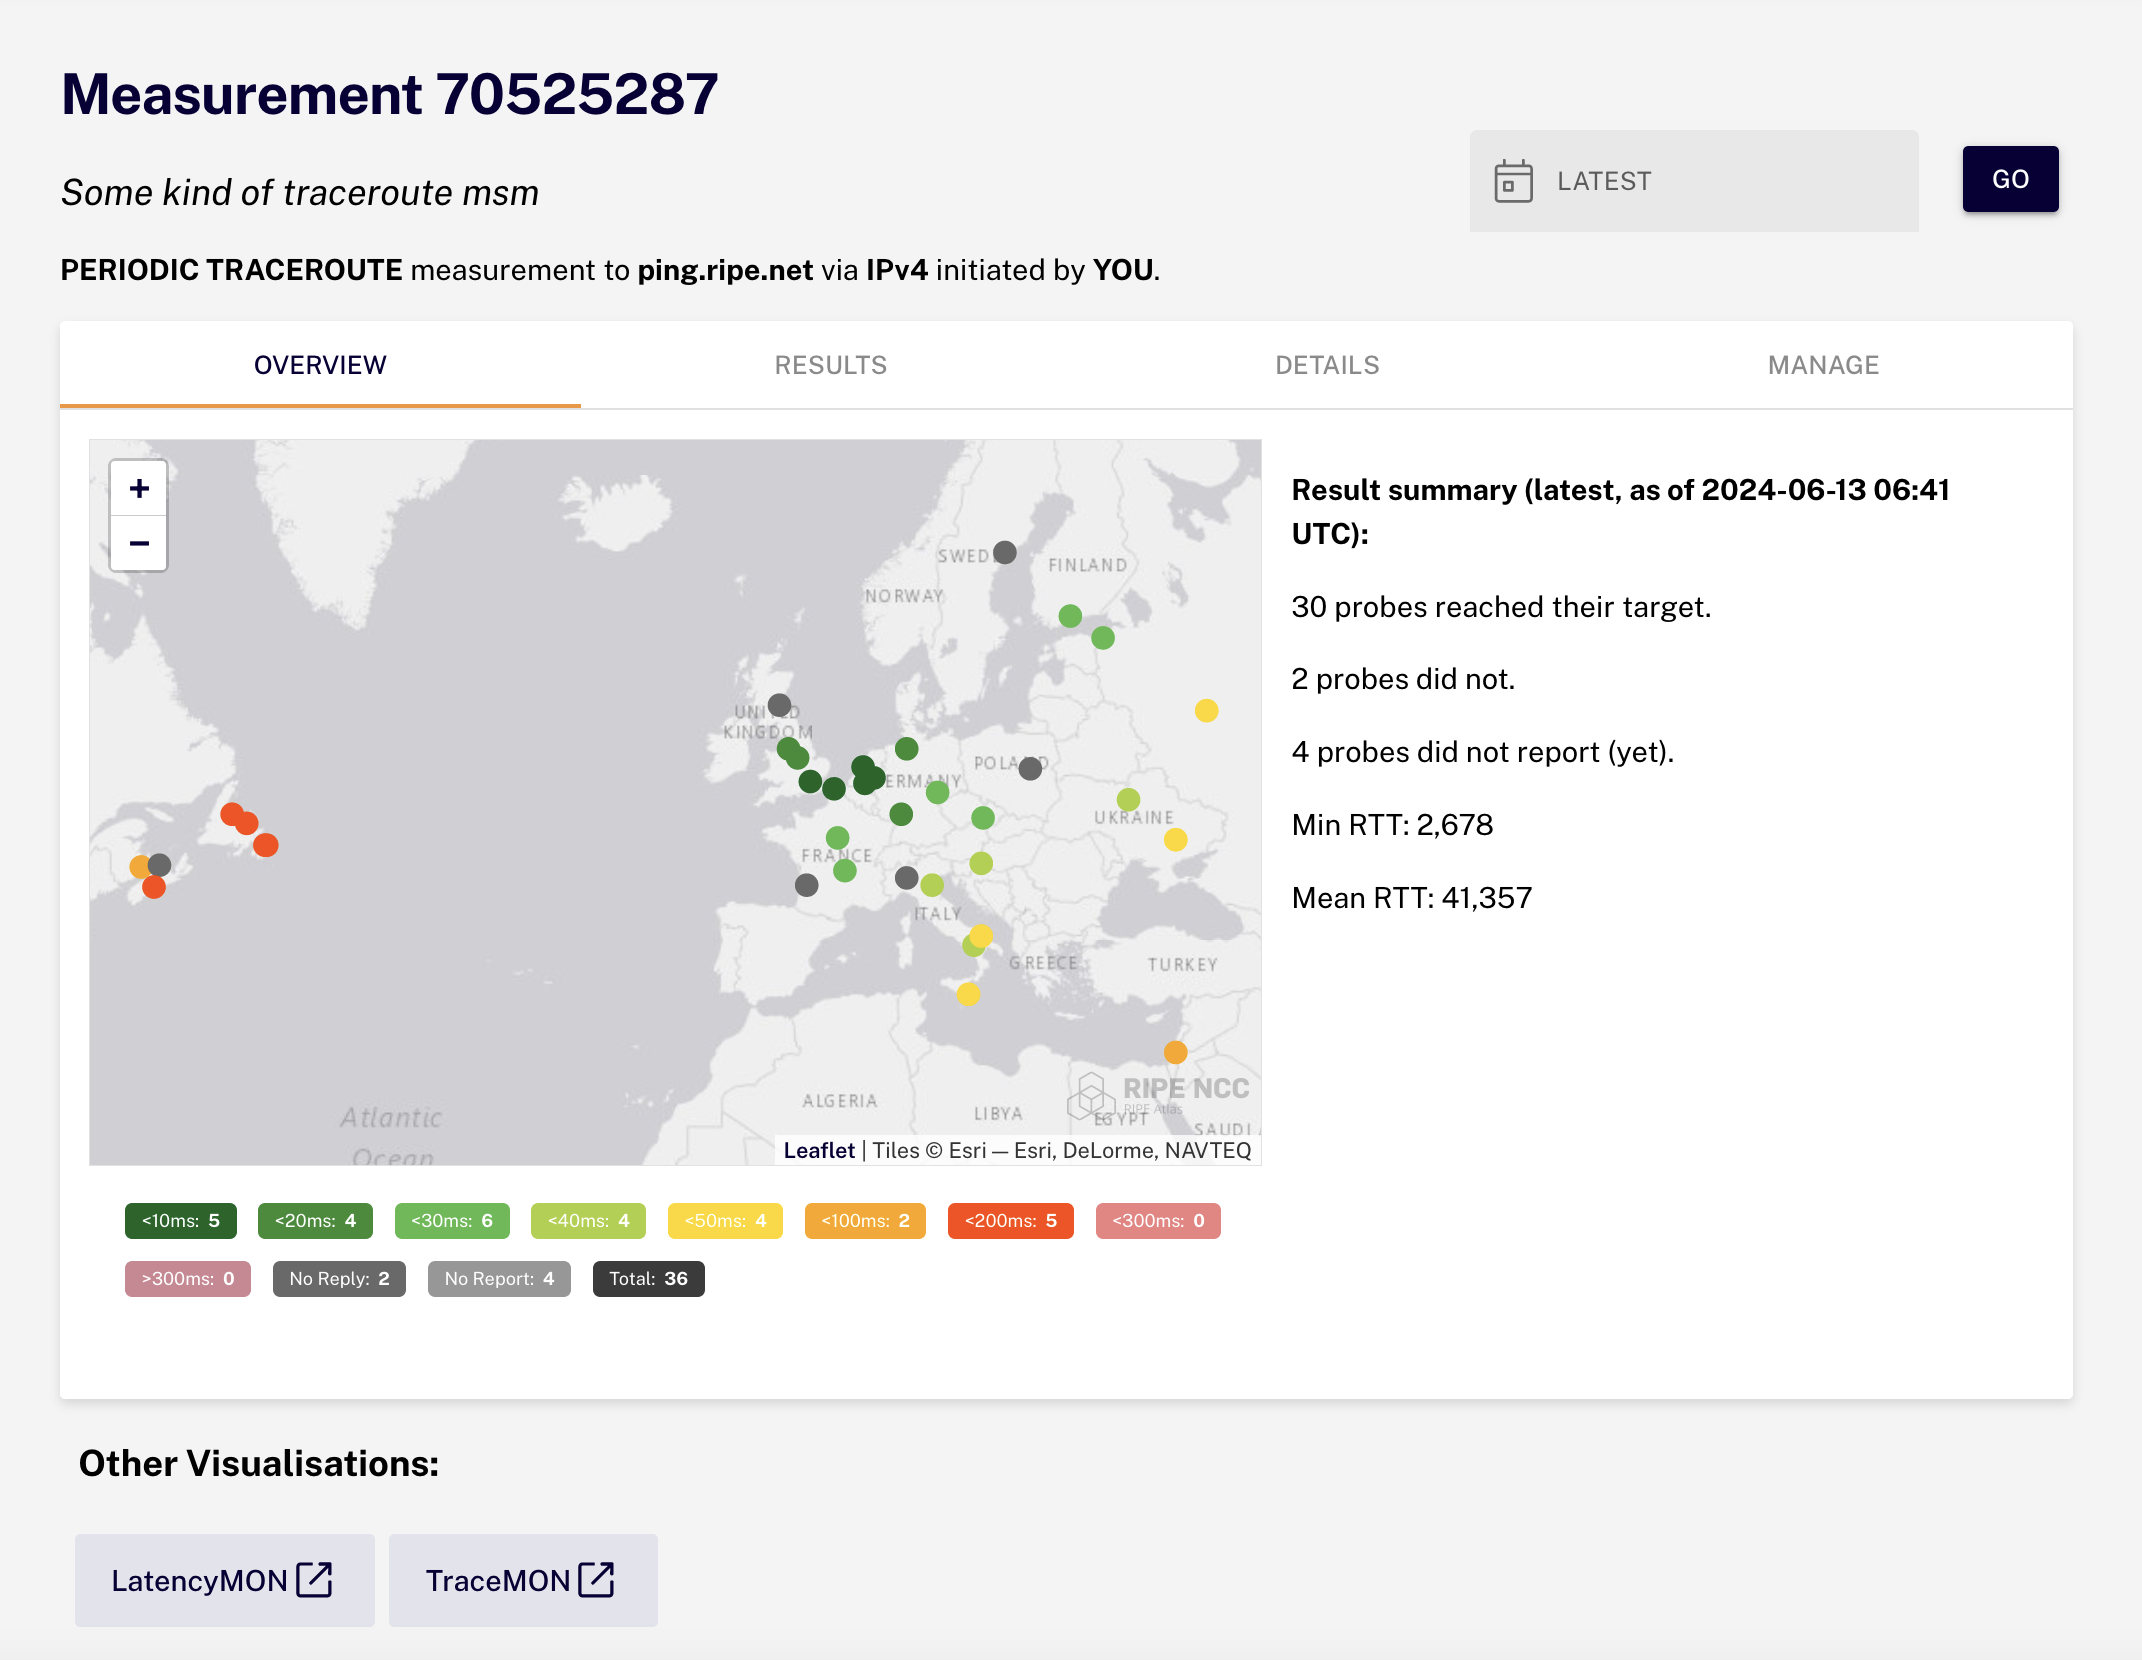
An individual measurement information page
# Quotas
The following quotas apply for users/measurements:
- No more than 100 simultaneous measurements
- No more than 1000 probes may be used per measurement
- No more than 100,000 results can be generated per day
- No more than 50 measurement results per second per measurement. This is calculated as the spread divided by the number of probes.
- No more than 1,000,000 credits may be used each day
- No more than 25 periodic and 25 one-off measurements of the same type running against the same target at any time
# Special Requests
If you have an especially interesting measurement you think might be of value to the community, but would exceed the rate limit or the number of credits you have available, please contact us at atlas@ripe.net to propose it as a study.