Probe Connectivity
Probe Connectivity shows when RIPE Atlas probes connected to and disconnected from the RIPE Atlas infrastructure over a period of time. Because probes are spread across many networks and countries, a large group of probes disconnecting at the same time is often a sign of a power or network outage in that area. You can use the tool to check whether an outage affected a country, a network or a location, and to see which probes were affected and for how long.
The tool is at atlas.ripe.net/use-cases/probe-connectivity (Probe Connectivity in the Use Cases menu). You don't need to be logged in to use it.
Where the Data Comes From
The tool only reads data that RIPE Atlas already collects. Using it doesn't schedule any measurements or cost any credits.
- Connection and disconnection events come from the built-in probe connection measurement (measurement 7000).
- A probe's state at the start of the period, its tags, and its ASNs and addresses at the start and end of the period come from the probe archive.
- Probes that have never connected are left out, as are probes that first connected after the end of the period.
Getting Started
- Under Time Selection, set the start and end of the period, in UTC. The default is the last seven days. Dates in the future aren't allowed.
- Under Probe Selection, choose how to select probes (see below).
- Click Load Probe Data.
Progress messages appear next to the button while the data loads. Large selections can take a while.
Selecting Probes
Choose one of these tabs:
| Tab | What to enter |
|---|---|
| Country | One or more countries. You can search the list or type comma-separated codes, for example NL,BE,DE. |
| ASN | One or more ASNs, comma-separated, for example 174,3333,1299. |
| Probe IDs | One or more probe IDs, comma-separated. |
| Location + Radius | A place name, for example Amsterdam, The Netherlands (the default), and a Radius (km) from 1 to 5000 (default 50). The place is looked up with OpenStreetMap, and all probes within the radius are included. |
| All Probes | Nothing. Every RIPE Atlas probe is included. This loads a large amount of data and can take some time. |
Separate by Controller
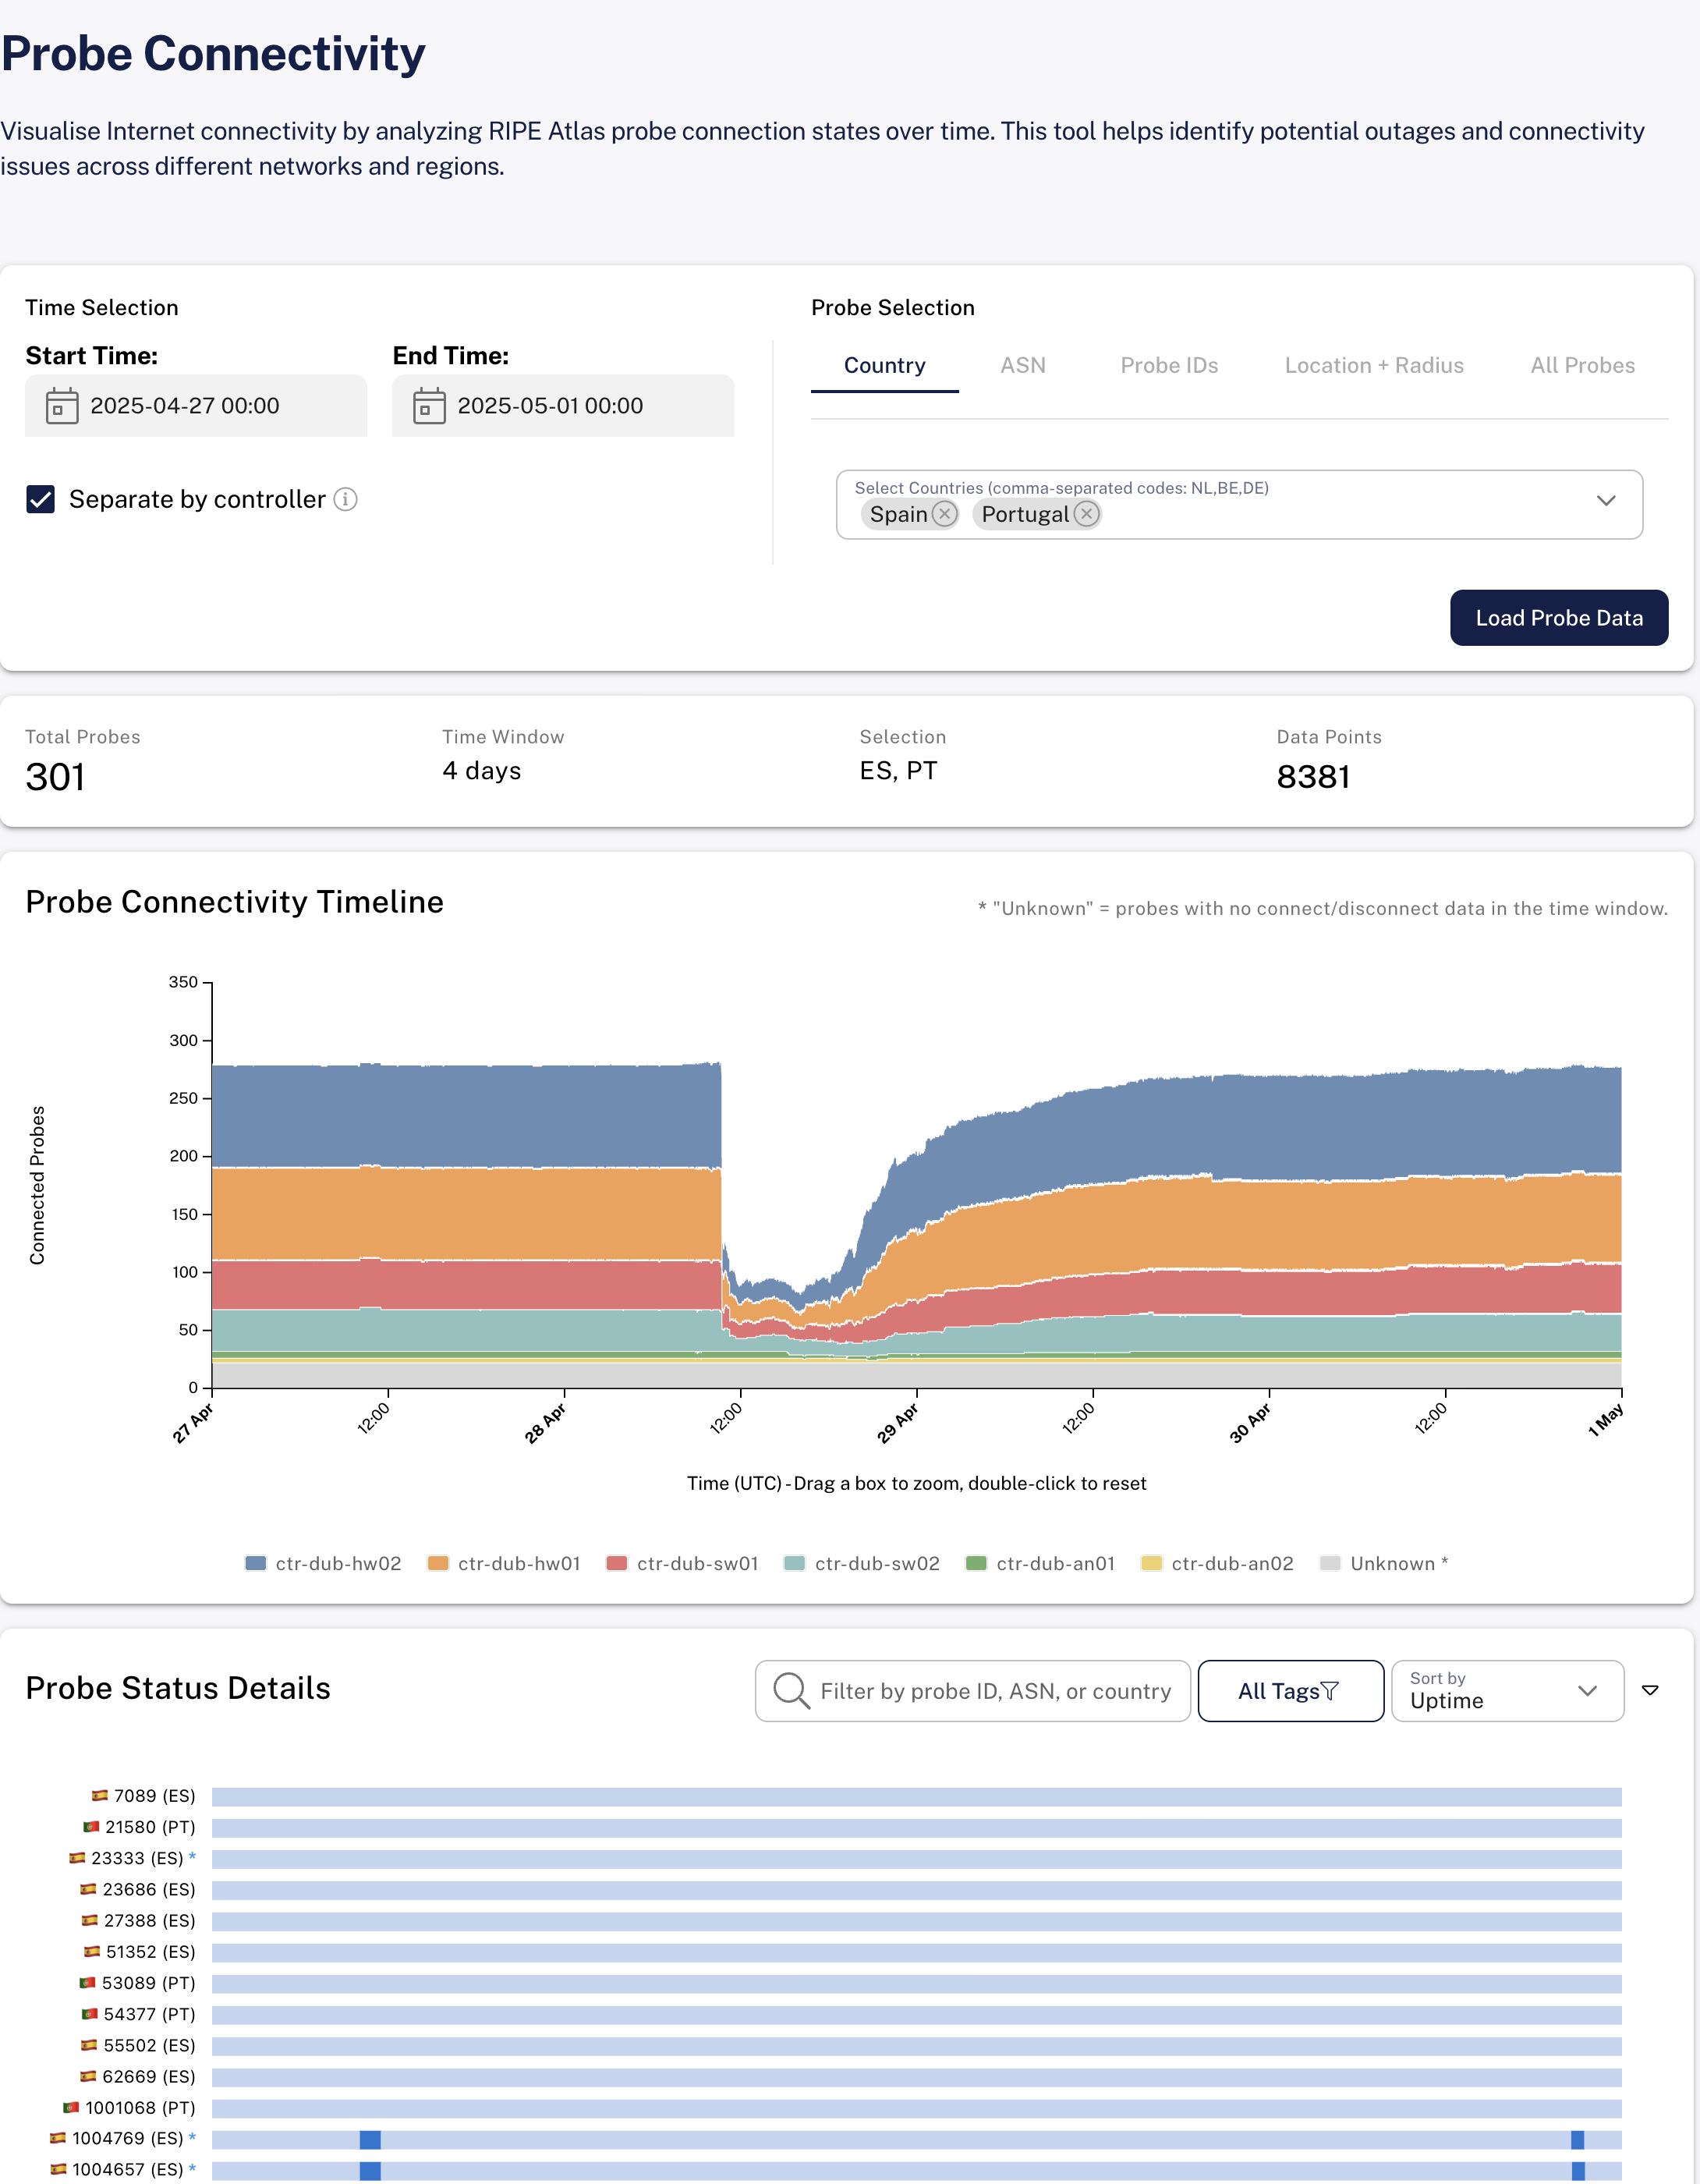
Tick Separate by controller before or after loading to split the timeline by the RIPE Atlas controller that each probe was connected through. A probe is counted under the controller of its most recent connection. Probes that connected before the period and didn't reconnect during it are counted as Unknown. Together, the controllers add up to the total.
The Results
Summary
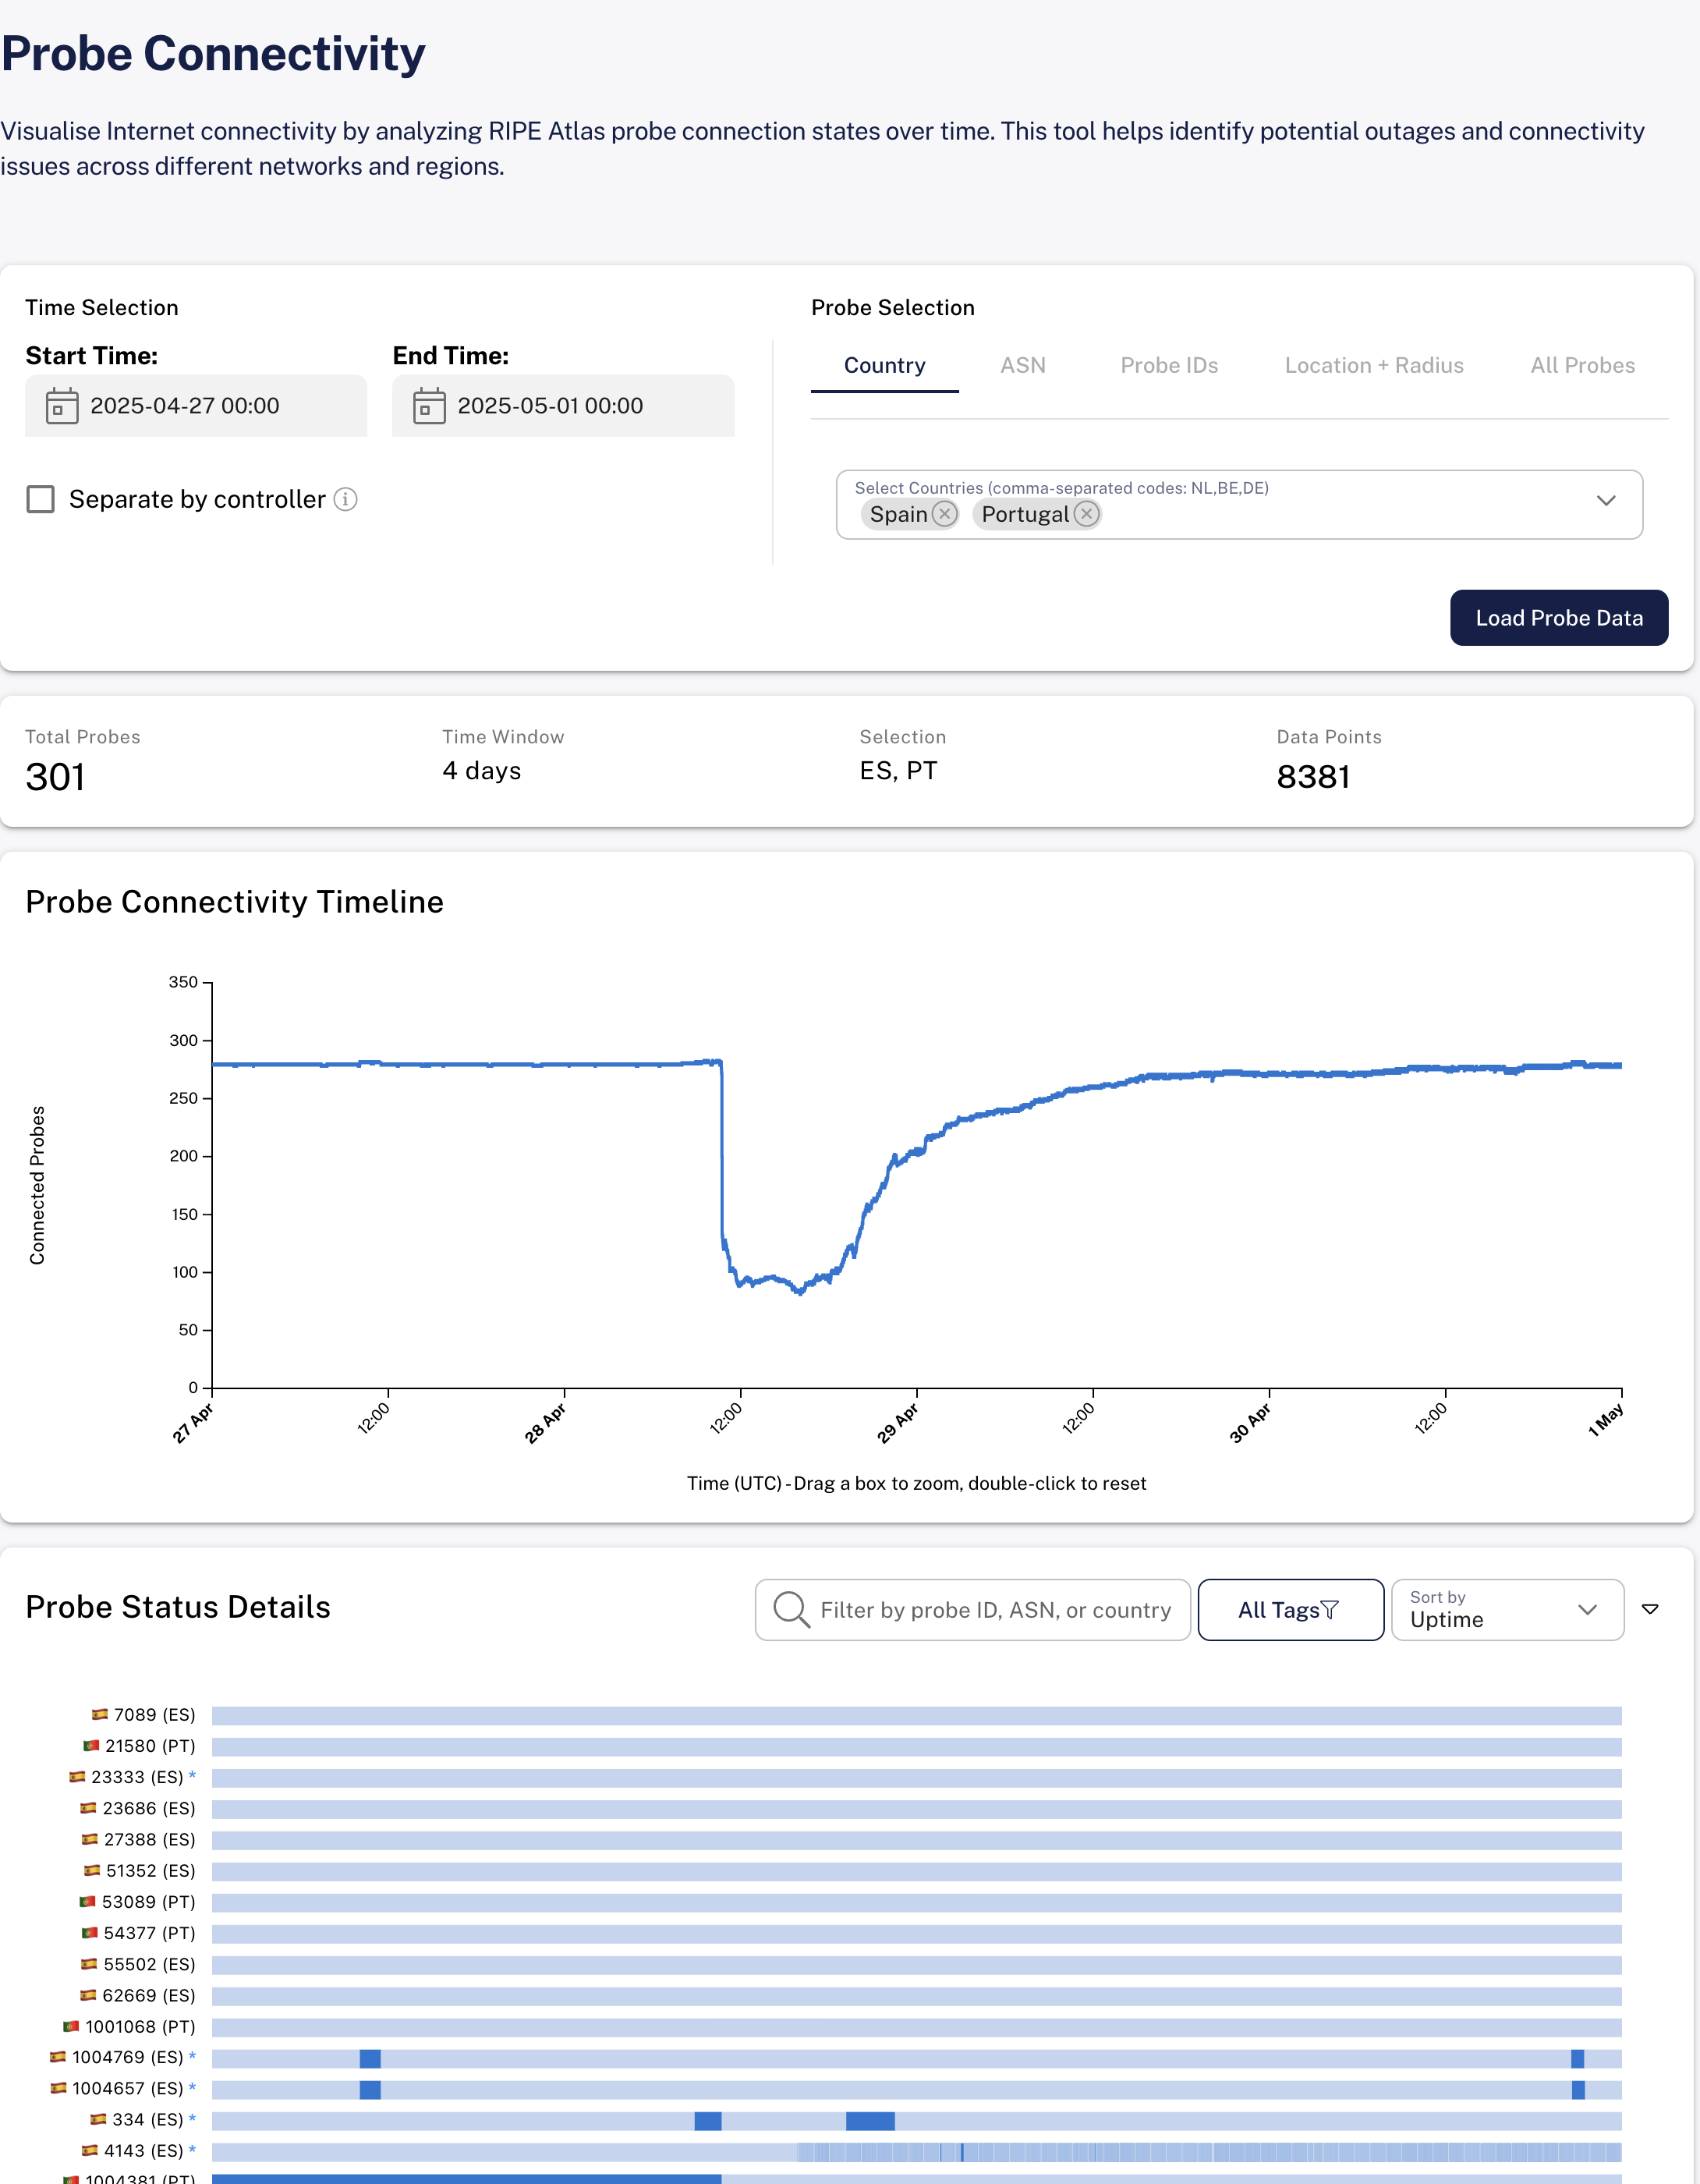
A summary card shows the Total Probes, the Time Window, the Selection and the number of Data Points loaded. When a filter is active, the counts are marked (filtered).
Probe Connectivity Timeline
The timeline plots the number of Connected Probes over time. A sudden drop means many of the selected probes disconnected at about the same time.
- Hover over the chart to see how many probes were connected at that time, and the time range that value covers.
- Drag a box on the chart to zoom in on that part of it, in both time and number of probes. Double-click to reset the view.
- With Separate by controller on, there is one band per controller, with a legend below the chart. The hover popup lists the number of connected probes per controller. If a significant share of probes is Unknown, a note above the chart explains it.
Probe Status Details
Below the timeline, Probe Status Details has a row for each probe. Each row shows when the probe was connected and when it was disconnected during the period.
- Hover over a bar to see the probe's ID, country, status, ASNs and IP addresses. If any of these changed during the period, the popup lists the changes under Changes during window.
- Click a bar or a probe label to open the probe's page in a new tab.
With All Probes, the per-probe rows are hidden at first because drawing them all can take a few seconds. Click Show per-probe detail to draw the probes that disconnected during the period. If no probes disconnected, a note says so.
Filtering and Sorting
These controls in the Probe Status Details header affect both the timeline and the per-probe rows:
- Filter by probe ID, ASN, or country: show only the probes that match the text.
- Tags: open Filter by Tags to choose which probe tags to include. Each tag shows how many of the loaded probes have it. A probe is shown if it has any of the selected tags. Use All Tags to select or clear them all. The button reads All Tags when no tag filter is active, and Tags (selected/total) when one is.
- Sort by: Uptime, Probe ID, Country or ASN, with a button to switch between ascending and descending. The default, Uptime descending, lists the probes with the most downtime first.
Sharing a View
The page URL is updated when you click Load Probe Data and when you change the sorting, tag filter or controller setting, so you can copy it from the address bar. Opening a URL that includes a selection loads the data automatically.
| Parameter | Meaning |
|---|---|
method | Selection tab: country, asn, probeids, location or allprobes |
start, end | Start and end of the period, in milliseconds since the Unix epoch |
countries | Comma-separated country codes, with method=country |
asns | Comma-separated ASNs, with method=asn |
probeids | Comma-separated probe IDs, with method=probeids |
location, radius | Place name and radius in km, with method=location |
tags | Comma-separated tags to filter on |
sort | uptime, id, country or asn |
direction | asc or desc |
controllerSplit | true to separate by controller |
For example:
https://atlas.ripe.net/use-cases/probe-connectivity/?method=country&countries=ES,PT&start=1745712000000&end=1746057600000
Tips
Checking whether an outage affected an area. Select the country, network or location, and choose a period that starts some time before the suspected event. A clear drop in the timeline that recovers later points to an outage. Sort Probe Status Details by Uptime to see which probes were down longest.
Telling an outage from a single probe problem. One probe going offline is common: its host may have unplugged it or lost power. Look for many probes disconnecting at the same moment, ideally in different networks.
Checking whether a disconnection was on the RIPE Atlas side. Turn on Separate by controller. If the drop is limited to one controller while the others stay steady, the cause may be that controller rather than the probes' networks.