Statistics
The Coverage and Statistics page shows statistical information about the RIPE Atlas network as a whole: where probes are, how much of the Internet they cover, how the network is doing right now, and how it has grown. Open it from Statistics in the sidebar. You don't need to be logged in.
The page has five tabs. Each tab has its own address, so you can link straight to it:
| Tab | Address |
|---|---|
| Coverage | https://atlas.ripe.net/statistics/coverage |
| Status | https://atlas.ripe.net/statistics/status |
| LIR Overview | https://atlas.ripe.net/statistics/lir-overview |
| Contributors | https://atlas.ripe.net/statistics/contributors |
| Trends | https://atlas.ripe.net/statistics/trends |
The page opens on the Coverage tab. The older address https://atlas.ripe.net/coverage/ also leads to it.
Coverage
Global RIPE Atlas Network Coverage
An interactive world map of RIPE Atlas probes and anchors. It has two views:
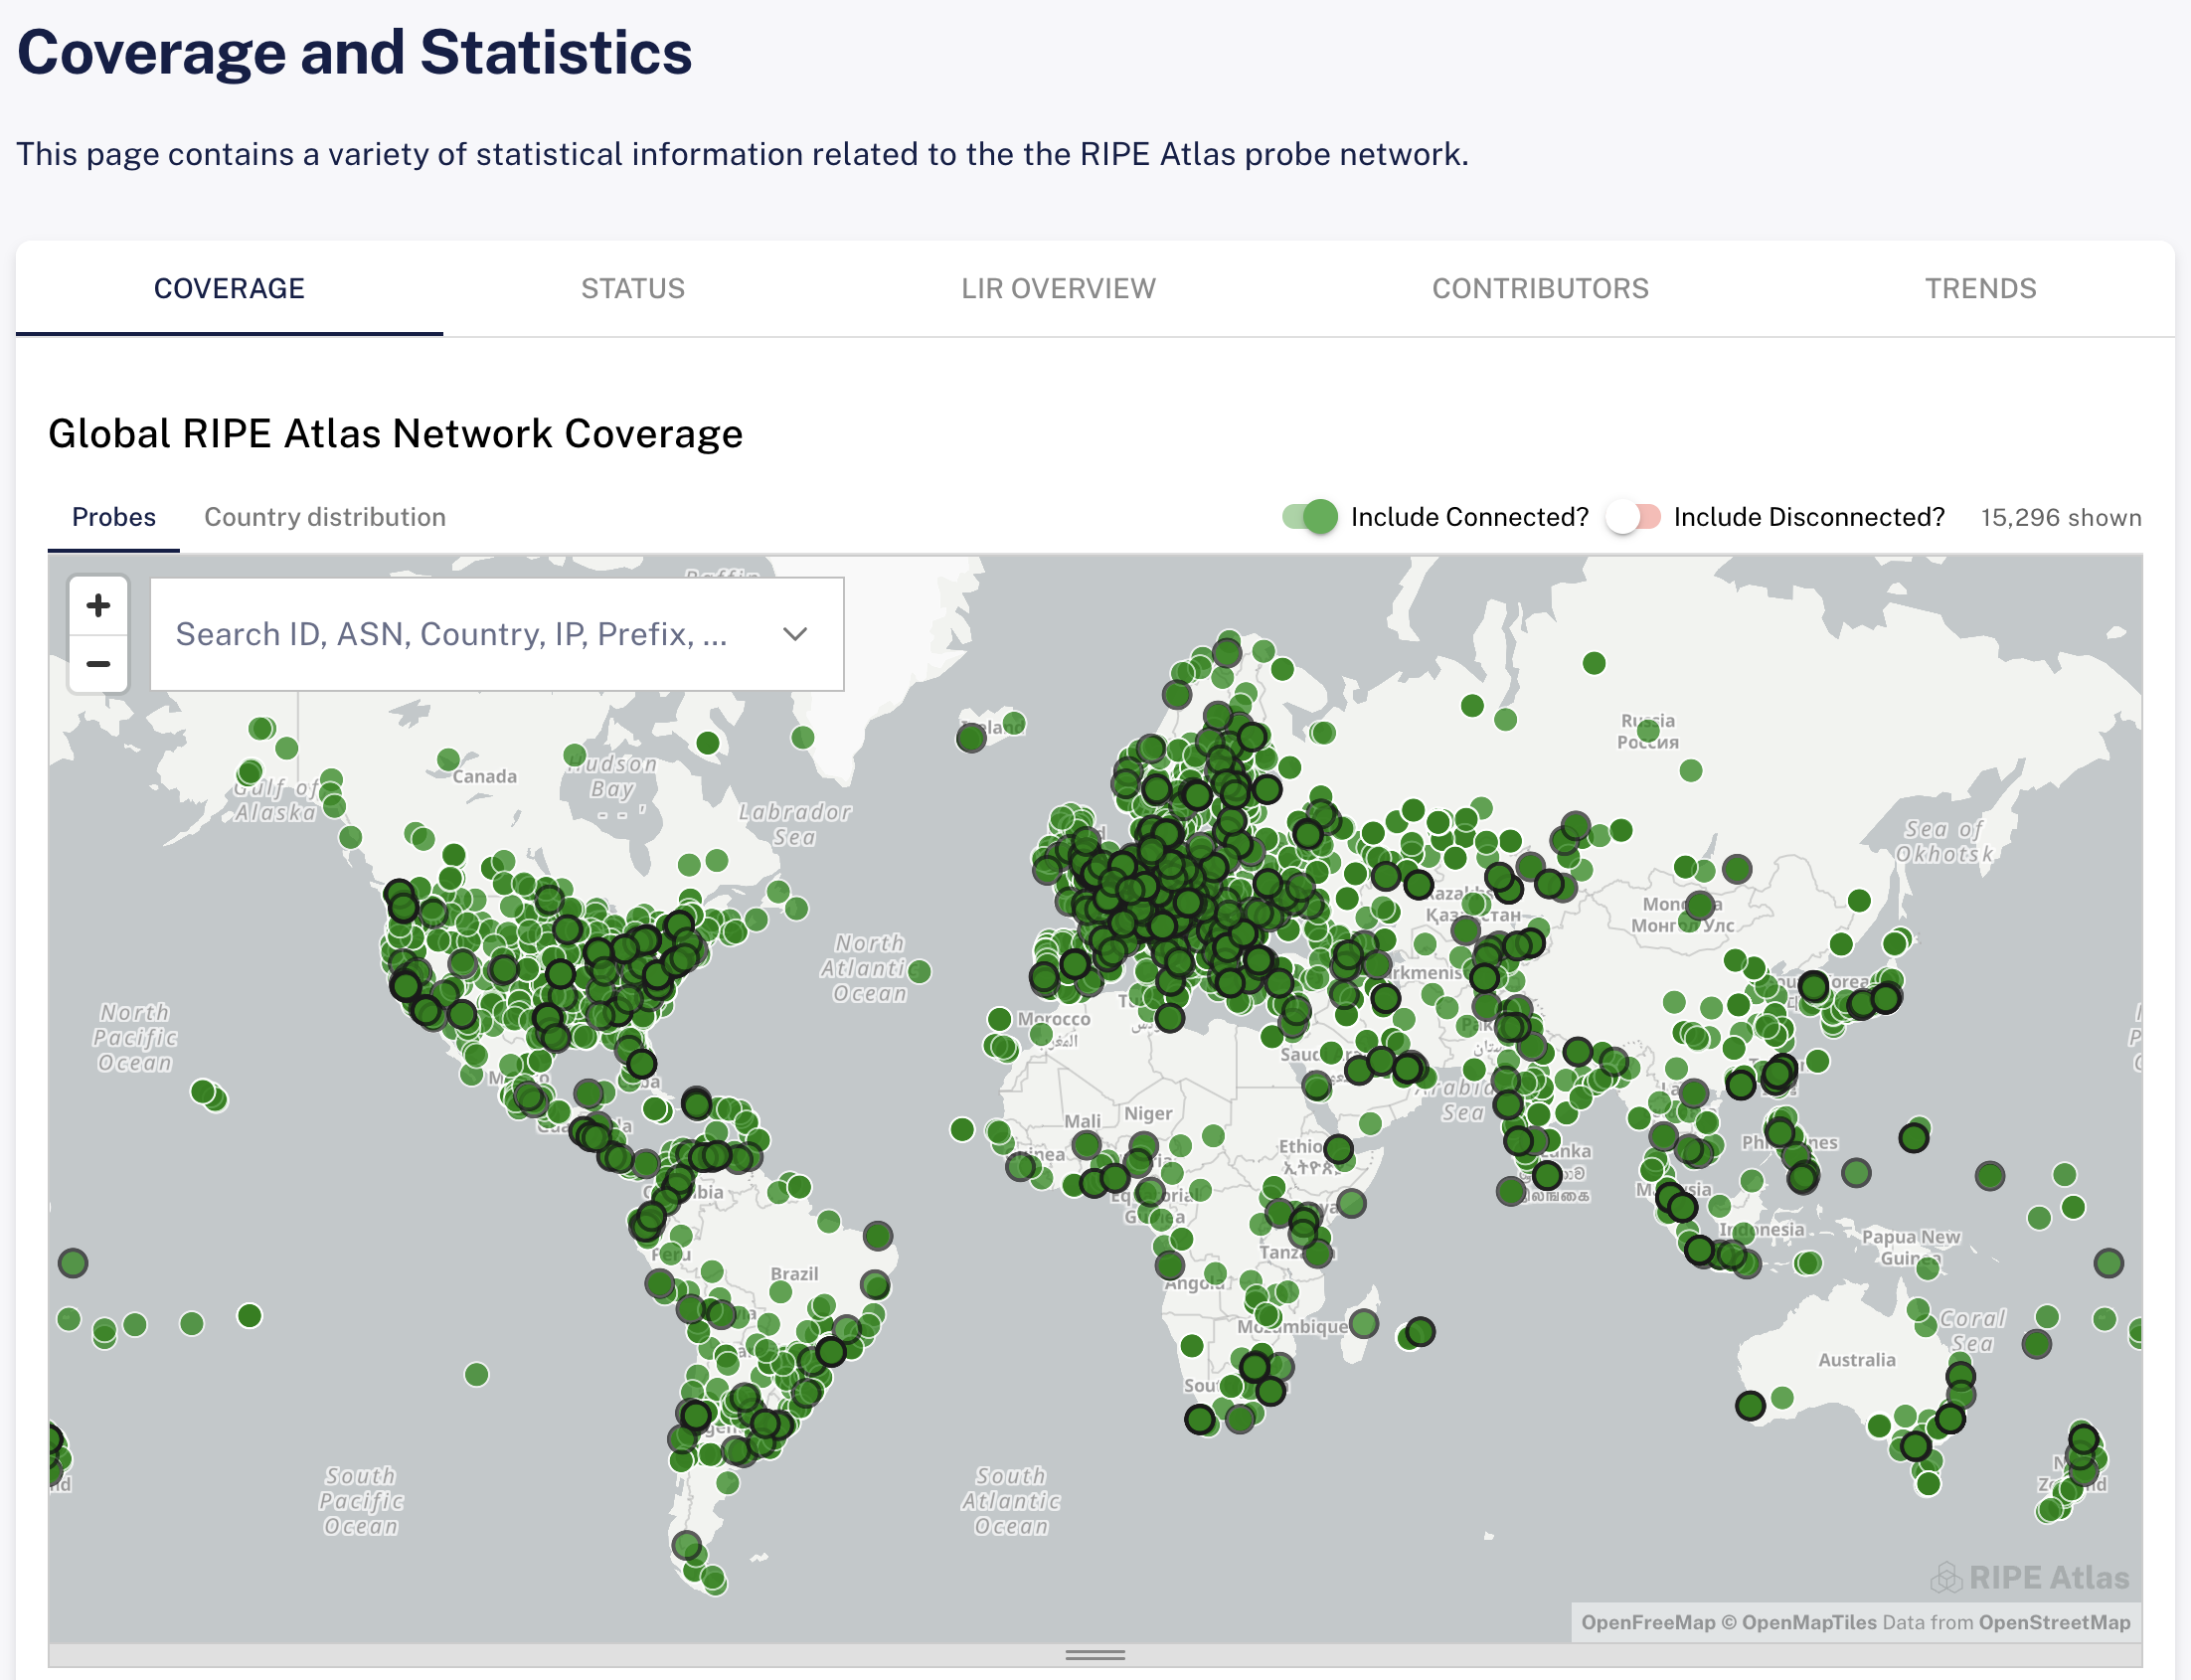
- Probes: every probe as a dot on the map, with anchors marked separately. Use Include Connected? and Include Disconnected? to choose which probes are shown. By default only connected probes are shown. The number of probes on the map is shown as N shown above it; hover over it for a breakdown into anchors and probes, and into connected, disconnected and abandoned.
- Country distribution: the number of probes in each country, shown as a shaded map with a Probes/Country legend. This view counts every probe, whatever its status.
Hover over a probe to see its details, such as its ID, ASNs and country, and click it to pin the popup so you can follow the links in it. The probe ID links to the probe's page.
Use the search box on the map to find probes by ID, ASN, country, IP address or prefix, or to jump to a place by its address. Your search is kept in the page address, so you can share a link to the same view.
If the probe data shown is more than an hour old, a refresh button appears next to the counts.
Population Coverage
A link to the RIPE Atlas population coverage page, which shows how well countries and networks are covered by probes. This is a prototype, so its address and features may change.
ASN / IP Prefix / Country Coverage
A table showing how many IPv4 ASNs, IPv6 ASNs and countries are Covered by RIPE Atlas probes, out of the Total, and the Percentage that represents.
Top ASNs / Prefixes / Countries
Pie charts of the ASNs (IPv4 and IPv6), prefixes (IPv4 and IPv6) and countries with the most probes. Click a slice to see those probes on the coverage map. Clicking the Other slice hides it, so the remaining slices are easier to read; click Restore Hidden Other Slices to bring it back.
Status
Global Indicators
Live figures for the network, including the number of connected probes (in total, hardware, software and anchors), the number of measurements running, and the number of results arriving per second. Consumption Delay shows how long it currently takes for results to be processed, as percentiles from p5 to p99.
The same delay is summarised by the system status dot at the top of your dashboard.
Measurements currently running
A table of the measurements currently running in RIPE Atlas, by measurement type, split into Built-in, Anchoring, DNSMON and Other measurements, plus Total (UDM) for user-defined measurements.
LIR Overview
All RIPE Atlas probes, anchors and measurements, organised by LIR (Local Internet Registry) and IP prefix, shown as an interactive bubble visualisation. Click a bubble to zoom in to an LIR or prefix, and use the zoom buttons to move back out.
The toolbar above the visualisation lets you narrow down what is shown:
- Search: search for LIRs, prefixes, IDs, types and targets. You can add several search terms; items matching any of them are shown. Use the clear button to remove all filters.
- Source: show items owned by you (Mine), by others (Others), or both.
- Types: show Probes hosted in the prefixes, Anchors hosted in them, and Measurements targeting them.
- Other: turn on Empty to also show LIRs with no probes, anchors or measurements. This is off by default.
For an overview of your own LIR as a RIPE NCC member, see also Member Overview.
Contributors
Use the switch at the top of the tab to choose between two lists, each shown as one table per month for recent months:
- Prominent Probes: the probes that delivered the most results, with their ID, Country and number of Results.
- Big Spenders: the users who spent the most credits, with Credits Spent.
Trends
Charts of how RIPE Atlas has grown over time:
- Users and Probes Over Time: the number of users and probes
- Anchors Over Time: the number of hardware and software anchors
Standalone coverage map
The coverage map is also available on its own, without the rest of the page or its controls, at:
https://atlas.ripe.net/coveragemaphttps://atlas.ripe.net/atlasmap
Both addresses show the same map. It fills the browser window, or the frame it is placed in, which makes it suitable for embedding in other web pages.